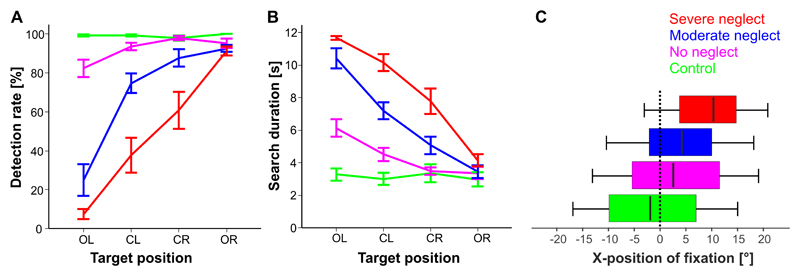
Figure 2. Desk task performance.
Detection rate (A) and search duration (B) are depicted separately for the four study groups and the horizontal x-position (column), where the target was presented on the screen: outmost left (OL), centre left (CL), centre right (CR) or outmost right (OR).
(C) Horizontal fixation distribution is illustrated as a boxplot function of fixations (cumulative time of gaze samples) in relation to the horizontal location where they landed on the screen, separately for the four study groups. The median band represents the Center of Fixation (CoF), where 50% of all gaze samples were left and 50% right of its x-position. Boxes represent the horizontal range where 25% (left end) or 75% (right end) of the fixations fell into. The ends of the whiskers reflect the leftmost and rightmost 2.5% of horizontal positions of fixations. After averaging over the participants of each group 95% of all gaze samples fell into that range, thus they represent the mean Field of Exploration for each study group.

