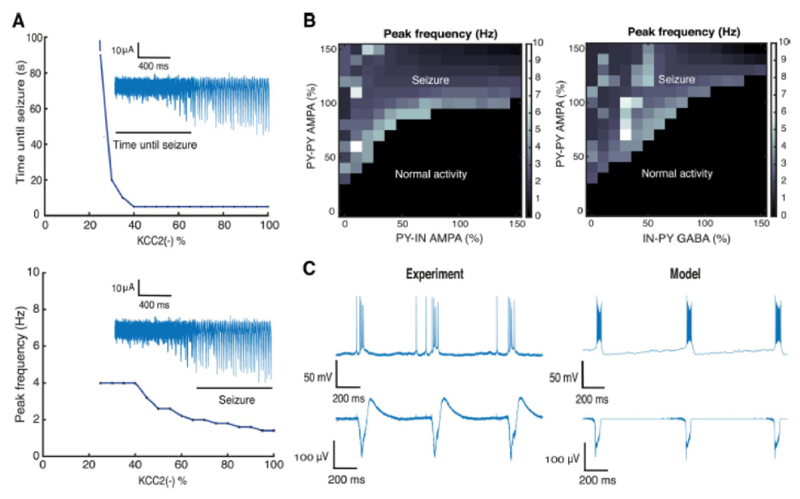
Figure 6. Analysis of epileptic oscillations.
A, relations between the number of KCC2(-) cells in the network, and time until seizure initiation and peak frequency of LFP spectrum. The insets show characteristic LFP traces. B, LFP peak frequency as a function of the mean strength of AMPA and GABA conductances in the network. C, population bursts generated after blocking inhibition in the model and experimental records (block with bicuculline). Synaptic conductances were varied from 0 to 150%: PY-PY 0 – 2.25 nS / cm2; PY-IN 0 – 1.5 nS / cm2; IN-PY 0 – 1.05 nS / cm2.

