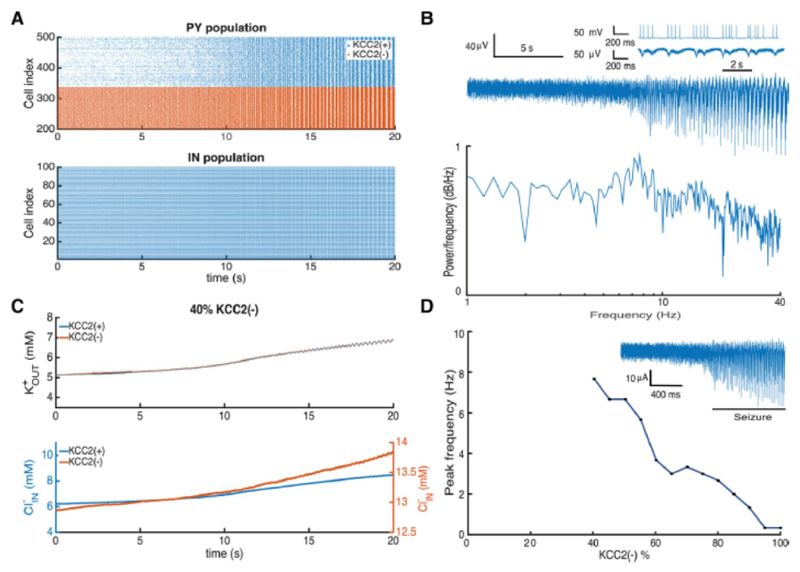
Figure 7. Adding KCC2(-) cells to the network with endogenous ion concentrations leads to the development of pathological oscillations.
A, activity of pyramidal cells (PY) and interneurons (IN) during seizure initiation. B, LFP trace computed from neuronal activity and corresponding power spectrum, the inset shows pyramidal cell activity during the seizure. C, changes in the extracellular potassium and intracellular chloride concentrations during seizure initiation. D, seizure frequency plotted against the proportion of KCC2(-) cells. The inset shows a typical LFP signal.

