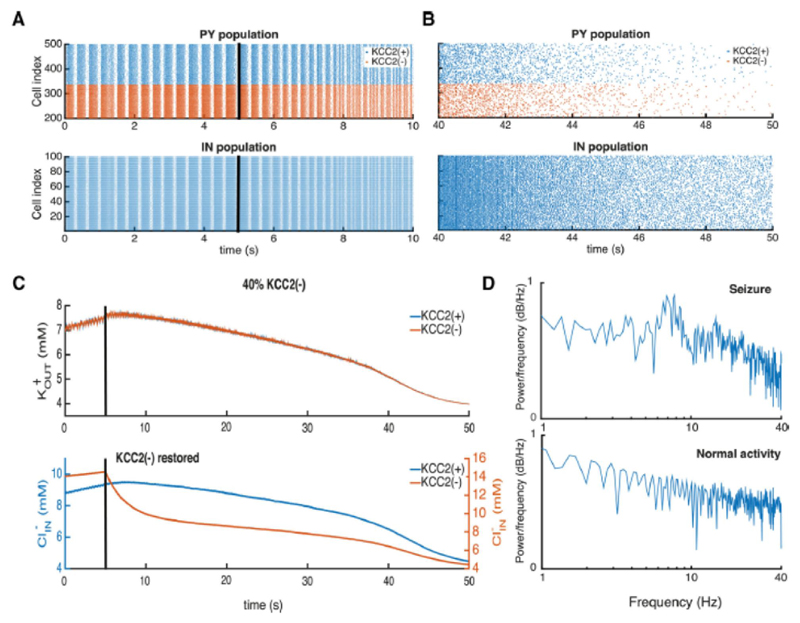
Figure 8. Restoring KCC2(-) function with realistic ionic levels prevents seizure.
A, B, raster plots of pyramidal cell (PY) and interneuron (IN) activities during seizure oscillations are shown on the left. Those during the transition to normal activity after restoring KCC2 function (black line at 5 sec) are shown on the right. C, changes in the extracellular potassium and intracellular chloride concentrations after restoring KCC2 function, at the black line. D, LFP power spectra during epileptic oscillations and after KKC2 function was restored in KCC2(-) cells.

