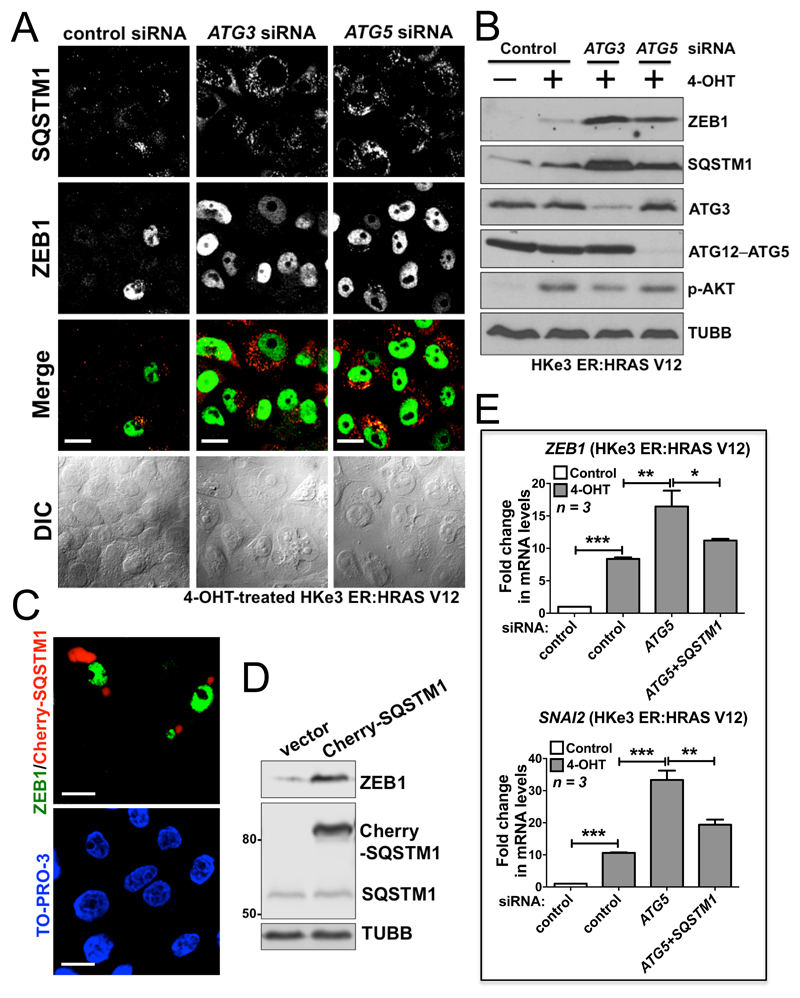
Figure 4. Autophagy inhibition promotes oncogenic RAS-induced EMT via SQSTM1.
(A) Immunofluorescence staining of SQSTM1 (red) and ZEB1 (green), and differential interference contrast (DIC) images from 4-OHT-treated HKe3 ER:HRAS V12 cells with the indicated treatments. Scale bar: 20 μm. (B) Protein expression of ZEB1, SQSTM1, ATG3, ATG12–ATG5 and phospho-AKT (p-AKT) in HKe3 ER:HRAS V12 cells with the indicated treatments. TUBB was used as a loading control. (C) 4-OHT-treated HKe3 ER:HRAS V12 cells were transfected with Cherry-SQSTM1 (red) followed by immunofluorescence staining of ZEB1 (green). TO-PRO-3 (blue) was used to stain nucleic acids. Scale bar: 20 μm. (D) Protein expression of ZEB1, exogenously expressed Cherry-SQSTM1 and endogenous SQSTM1 in 4-OHT-treated HKe3 ER:HRAS V12 cells transfected with control vector or Cherry-SQSTM1. TUBB was used as a loading control. (E) Fold change in mRNA levels of ZEB1 and SNAI2 in HKe3 ER:HRAS V12 cells with the indicated treatments. mRNA levels normalized to GAPDH in control cells were used to set the baseline value at unity. Data are mean ± s.d. n = 3 samples per group. * P < 0.05. ** P < 0.01. *** P < 0.001.

