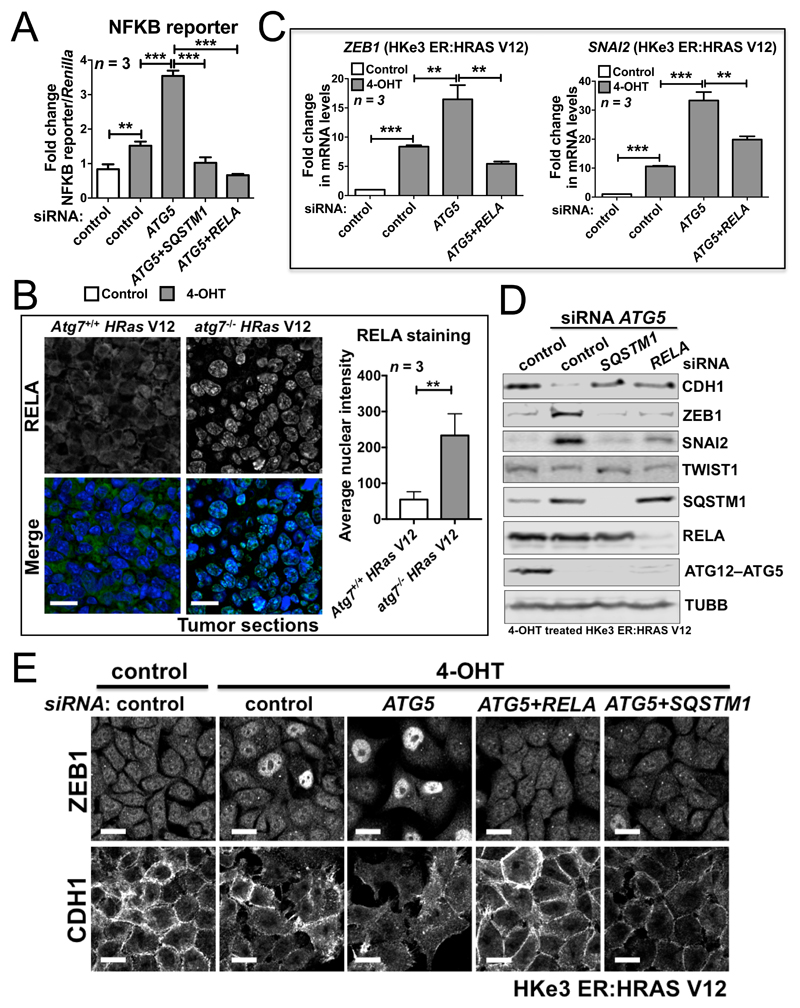
Figure 5. SQSTM1 accumulation resulting from autophagy inhibition in RAS-mutated cells activates the NFKB pathway to promote EMT.
(A) Fold change in NFKB reporter activity in HKe3 ER:HRAS V12 cells with the indicated treatments. NFKB reporter luciferase readings normalized to Renilla in control cells were used to set the baseline value at unity. Data are mean ± s.d. n = 3 samples per group. ** P < 0.01. *** P < 0.001. (B) Immunofluorescence staining of RELA (green) in HRas V12-expressing Atg7+/+ or HRas V12-expressing atg7-/- tumors. TO-PRO-3 (blue) was used to stain nucleic acids. Scale bar: 20μm. Atg7+/+ or atg7-/- iBMK cells transduced with HRas V12 were subcutaneously injected in nude mice to form tumors. The graph shows the average nuclear intensity of RELA evaluated with ImageJ, and data are mean ± s.d. n = 3 random fields. ** P < 0.01. (C) Fold change in mRNA levels of ZEB1 and SNAI2 in HKe3 ER:HRAS V12 cells with the indicated treatments. mRNA levels normalized to GAPDH in control cells were used to set the baseline value at unity. Data are mean ± s.d. n = 3 samples per group. ** P < 0.01. *** P < 0.001. (D) Protein expression of CDH1, ZEB1, SNAI2, TWIST1, SQSTM1, RELA and ATG12–ATG5 in HKe3 ER:HRAS V12 cells with the indicated treatments. TUBB was used as a loading control. (E) Immunofluorescence staining of ZEB1 or CDH1 in HKe3 ER:HRAS V12 cells with the indicated treatments. Scale bar: 20 μm.

