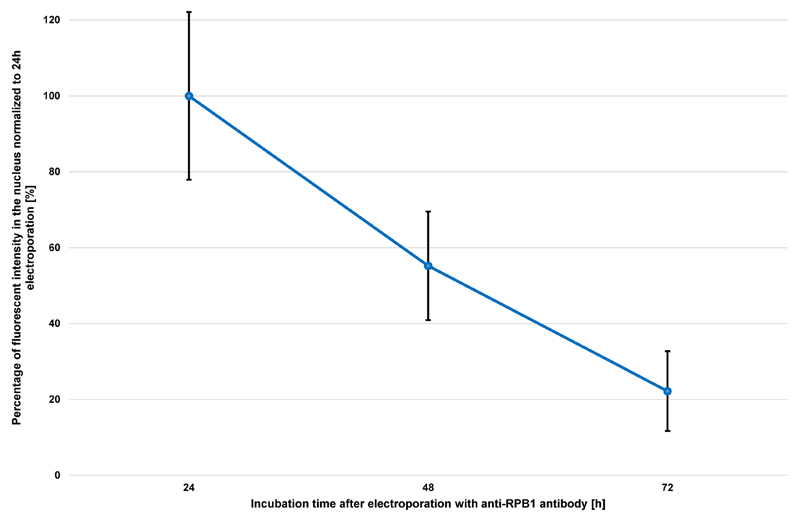
Figure 4. Progression of nuclear fluorescent signal over 72 h after electroporation of anti-RPB1 antibodies.
U2OS cells were transduced with 2 μg of anti-RPB1 antibodies and were fixed 24 h, 48 h or 72 h after electroporation and analyzed using confocal microscopy. The fluorescent intensity in the nucleus of the cells (n = 20) for each time point was measured and the mean values were normalized to the sample fixed 24 h after electroporation. Error bars represent the standard deviation obtained with 20 recorded cells for each time point.

