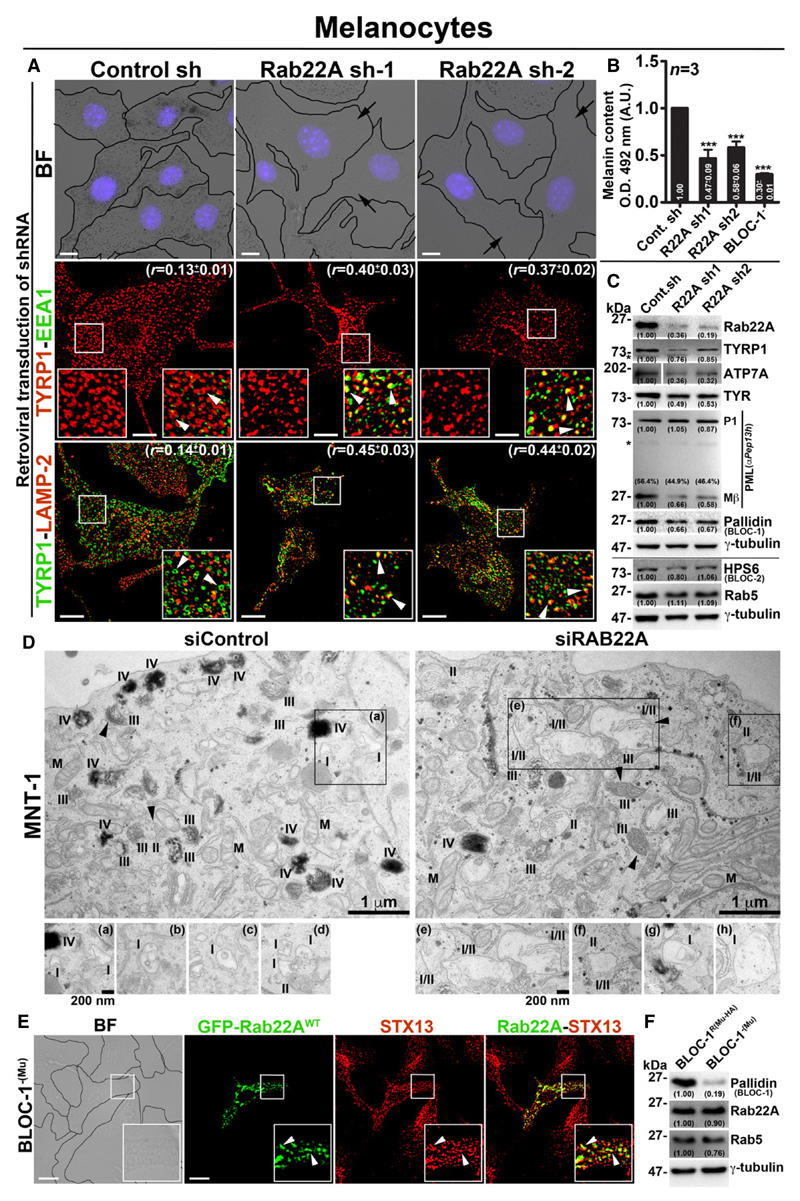
Figure 4. Rab22A regulates melanocyte pigmentation, cargo transport and functions upstream of BLOC-1.
A BF and IFM images of control and Rab22A-depleted melanocytes. The colocalization coefficient (r, in mean ± SEM) between the two markers indicated separately. Nuclei are stained with Hoechst 33258.
B Graph represents the quantified melanin content in control sh, Rab22A sh and BLOC-1− melanocytes. n = 3. The fold change in melanin content (mean ± SEM) indicated separately. ***P ≤ 0.001 (unpaired Student’s t-test).
C Immunoblotting analysis of proteins in control sh and Rab22A sh melanocytes.
D EM of control and Rab22A-knockdown MNT-1 melanocytes. Arrowheads indicate PMEL fibrils. Scale bars: 1 μm. I, II, III, IV: stages of melanosomes. M: mitochondria. Magnified view of insets is shown separately, and they emphasize the stage I melanosomes in both conditions. Note: the presence of hybrid stage I/II melanosomes in Rab22A-knockdown cells. Insets (b–d) and (g, h) are from different cells of respective condition. Scale bars: 200 nm.
E BF and IFM images of GFP-Rab22A-transfected BLOC-1−(Mu) melanocytes.
F Immunoblotting analysis of proteins in BLOC-1− and BLOC-1R melanocytes.
Data information: In (A, E), arrows indicate the melanocyte pigmentation and arrowheads point to the localization of TYRP1/GFP-Rab22A. Scale bars: 10 μm. In (C, F), protein band intensities were quantified and indicated on the gels. *, non-specific bands.

