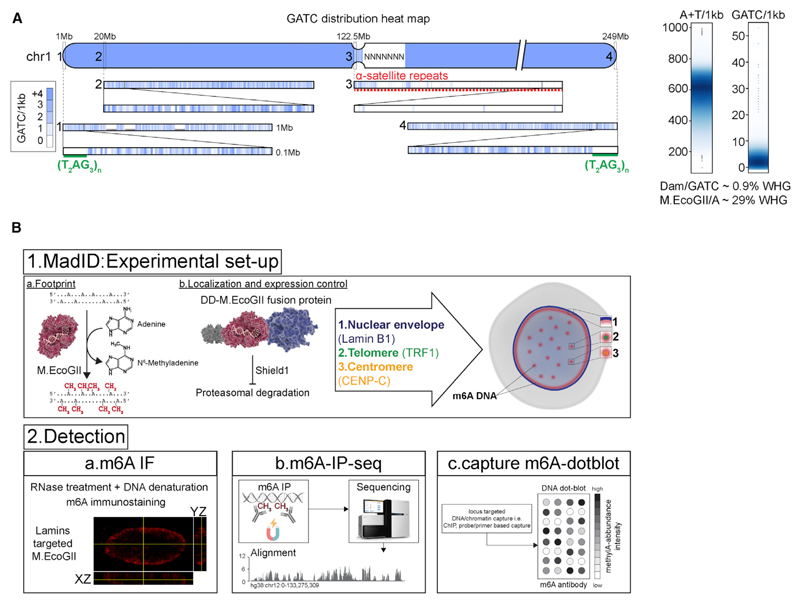
Figure 1. Schematic Overview of MadID.
(A) Left, GATC distribution on human chromosome 1 (hg38 assembly). The blue gradient represents the score for the GATC site within 1 kb genome segments. Magnification from 1 to 0.1 Mb is shown. Green line, telomere T2AG3 sequence; red dashed line, 1 Mb of centromere DNA. Right, smooth scatter graphs of the A+T nucleotide and GATC motif count per 1 kb genome segment (hg38, chromosomes [chr] 1–22, X, and Y).
(B) Experimental setup and detection. (1a) DNA methyltransferases catalyze the transfer of a methyl group to DNA. (1b) M.EcoGII is fused to a destabilization domain (DD) for proteasome degradation unless the compound Shield1 is added to stabilize the protein. M.EcoGII is targeted to the nuclear envelope by fusion with Lamin B1, to telomeres by fusion with telomeric repeat binding factor 1 (TRF1), or to centromeres by fusion with CENP-C. Precise targeting of M.EcoGII causes methylation of DNA in the surrounding regions (m6A). (2a) m6A detection in situ by immunostaining with a m6A antibody. (2b) Genome-wide m6A detection by m6A-specific immunoprecipitation (m6A-IP), followed by whole-genome sequencing. (2c) DNA regions of interest can be purified by chromatin immunoprecipitation or probe-based capture techniques, and m6A can be detected on dot blots using the m6A-specific antibody.

