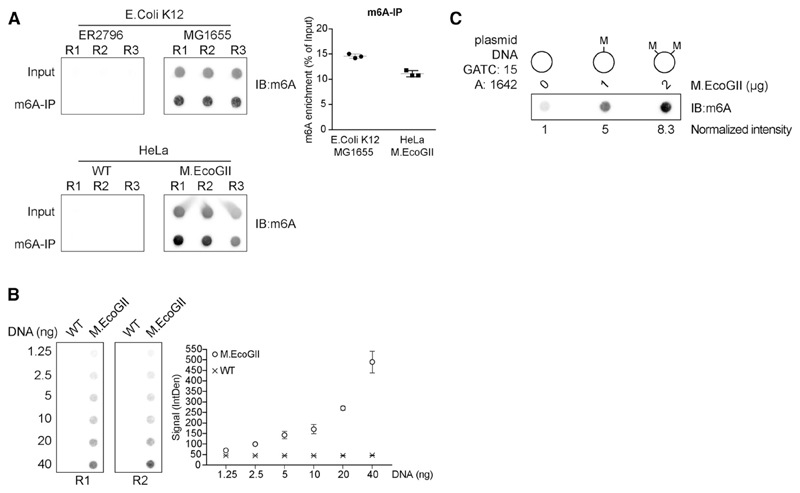
Figure 2. Activity of M.EcoGII and Detection of m6A-DNA.
(A) Dot blot of fragmented genomic DNA (input) or DNA immunoprecipitated with a m6A antibody (m6A-IP) from E. coli ER2796, E. coli MG1655, or U2OS cells expressing or not expressing M.EcoGII. The membranes were probed with a m6A antibody. Quantification of m6A enrichment in the immunoprecipitated fractions relative to the input material is shown from three independent replicates (R1, R2, and R3; mean ± SD).
(B) Dot blot with increasing amounts of sheared genomic DNA extracted from U2OS cells expressing or not expressing M.EcoGII. The membrane was probed with a m6A antibody. The graph represents the mean intensity ± SD of the m6A signal from two independent experiments (R1 and R2).
(C) Dot blot of plasmid DNA in vitro methylated with increasing amounts of M.EcoGII recombinant enzyme. 500 ng of DNA from each reaction was loaded on a membrane probed with a m6A antibody. The normalized intensity relative to the unmethylated plasmid is shown.

