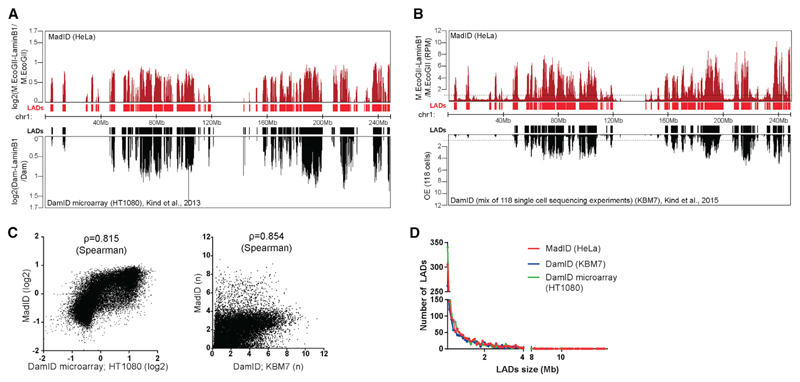
Figure 5. Identification of Lamin-Associated Domains Using MadID.
(A) Comparison nuclear lamina contact map for chr1 (hg38) with MadID from HeLa 1.2.11 cells (top profile) (ArrayExpress: E-MTAB-6888) and with conventional microarrays DamID from HT1080 cells (bottom profile); y axis, log2. Below the track, graphical representation of identified lamin-associated domains (LADs) as continuous regions in which all 100 kb segments have a score > 0.
(B) Comparison nuclear lamina contact map for chr1 (hg38) with MadID from HeLa 1.2.11 cells (top profile) (ArrayExpress: E-MTAB-6888) and with single-cell DamID sequencing (DamID-seq) of KBM7 cells. An average of 118 single-cell profiles is shown (bottom profile). Below the track, graphical representation of identified LADs as continuous regions in which all 100 kb segments have a score > 1.
(C) Left, log2 score of MadID in individual 100 kb bin (y axis) versus log2 score of conventional DamID in individual 100 kb bin (x axis). Genome-wide Spearman’s ρ = 0.815 between the two methods. Right, score of MadID in individual 100 kb bin (y axis) versus average score of 118 single-cell DamID-seq in individual 100 kb bin (x axis). Genome-wide Spearman’s ρ = 0.854 between the two methods.
(D) Frequency distribution (y axis) of the length of identified LADs (x axis) using MadID (red line), DamID-seq from 118 cells (blue line), and DamID using microarray (green line).

