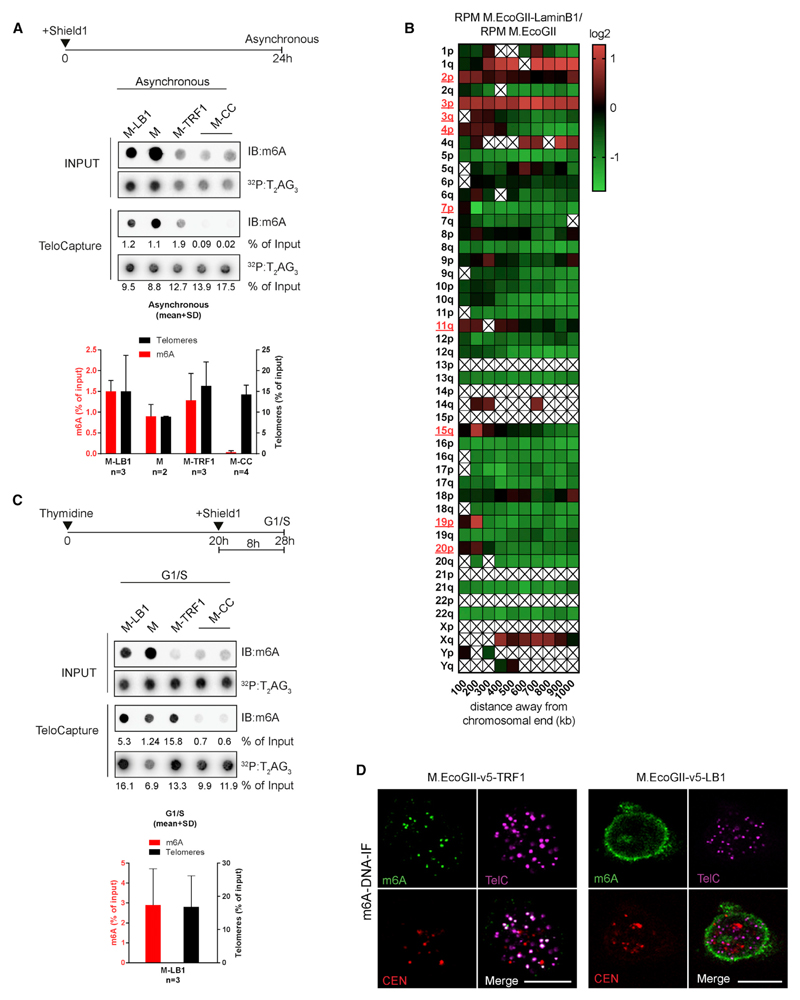
Figure 7. M.EcoGII Targeted to the Nuclear Envelope Can Contact and Methylate Telomeric DNA.
(A–C) Representative dot blot of captured telomeric DNA from asynchronous HeLa 1.2.11 induced to express the indicated vectors for 24 hr (A) or G1/S-arrested cells induced for 8 hr (C). DNA was probed with a m6A antibody (m6A) and a telomeric probe (T2AG3). The graph represents the normalized intensities relative to input (mean ± SD). (B) Heatmap of the number of reads per million obtained at individual chromosome ends in HeLa 1.2.11 cells expressing M.EcoGII-Lamin B1 (M-LB1). The log2 M.EcoGII-LB1/M.EcoGII ratio is shown. Chromosome ends with positive enrichment are highlighted in red. A box with a cross represents a bin without an associated DNA sequence and therefore excluded from the analysis.
(D) Representative DNA-IF of G1/S-arrested HeLa 1.2.11 cells induced to express the indicated vectors for 8 hr. m6A (green); TelC, telomeres (magenta); CEN, centromeres (red); DNA (blue); and merge. Scale bar, 10 μm.

