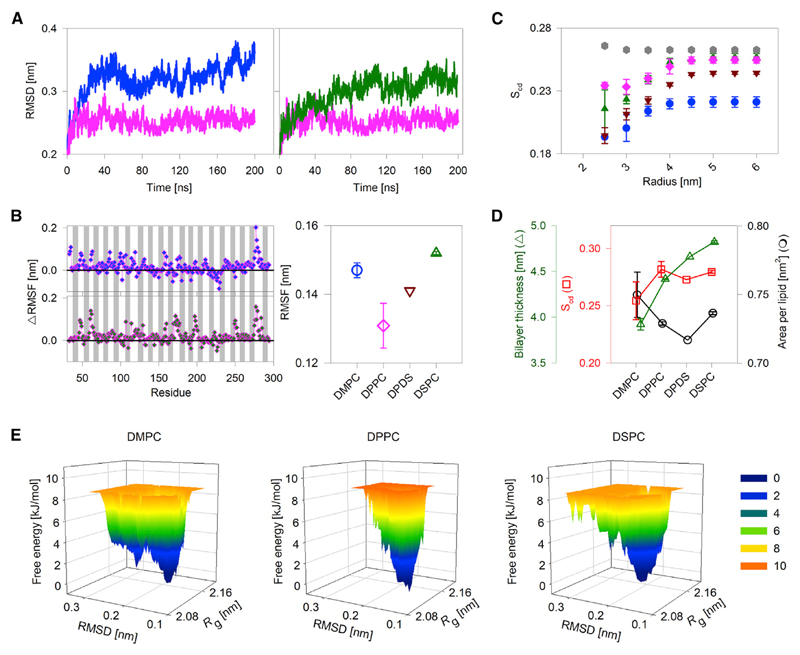
Figure 2.
hVDAC2-lipid parameters derived from all-atom MDSs. (A) A comparison of the RMSD in DMPC (blue), DPPC (pink), and DSPC (green) for the transmembrane region of hVDAC2. The RMSD is lowest in DPPC. (B) A comparison of per-residue ΔRMSF (left) and overall RMSF of the transmembrane region (right) in PC bilayers. ΔRMSF was calculated for each residue as RMSFDMPC – RMSFDPPC (left, top) and RMSFDSPC – RMSFDPPC (left, bottom). The 19 β-strands are indicated by gray bars, and loop regions are shown as white spaces (α1 is omitted). Data for DPPC + DSPC (DPDS) is in brown. The RMSF is lowest in DPPC. (C and D) Variation in lipid physical properties such as bilayer order parameter (Scd), area per lipid (APL), and bilayer thickness in the presence of hVDAC2. (C) Bilayer Scd was calculated for 50 frames from 10 to 200 ns trajectory are plotted for each acyl carbon of DMPC (blue circle), DPPC (pink diamond), DSPC (green upward triangle), and DPDS (brown inverted triangle) protein-lipid bilayer systems. Also included as control is the Scd for DPDS bilayer without protein (gray hexagons), wherein no change in the Scd is seen. The magnitude of increase in Scd is lowest in DPPC; DPPC also shows the highest Scd near the protein. Also note that the presence of protein decreases the overall Scd (compare gray hexagons with brown inverted triangles at 6 nm). (D) Average Scd, APL, and bilayer thickness derived from 50 frames of the 10 to 200 ns trajectory for the four lipid conditions shows a nonlinear change in Scd, APL, and bilayer thickness with a linear increase in the acyl-chain length. All error bars are from two independent 200 ns simulations. (E) A representative FEL plotted with respect to the radius of gyration (Rg) and RMSD of hVDAC2 in DMPC, DPPC, and DSPC bilayers. In DPPC, hVDAC2 samples a limited number of compact conformations (see the lower Rg values) and also lower RMSD values along the trajectory when compared to other lipids. Numbers beside the color scale correspond to the free energy in kJ/mol. A lower free-energy value corresponds to a more stable system. Additional data and analyses are presented in Figs. S5–S16. To see this figure in color, go online.

