Figure 3.
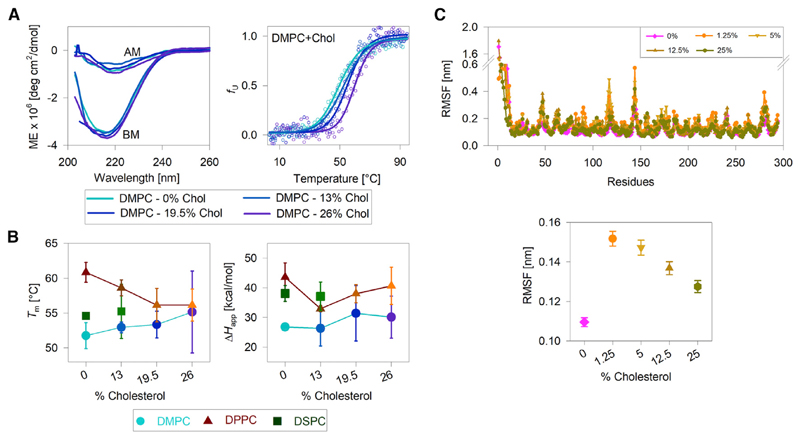
Effect of bilayer thickness and acyl-chain ordering on hVDAC2 stability. (A, left) Representative far-UV CD wavelength scans of folded hVDAC2 at 4°C in DMPC bicelles doped with increasing mole percent of cholesterol (0–26%). BM, before thermal denaturation; AM, after thermal denaturation. (A, right) Dependence of the unfolded protein fraction (fU) on temperature, derived from far-UV CD thermal unfolding at 215 nm (see foot of the figure for color code). Fits of the data to a two-state thermal denaturation model to derive Tm and ΔHapp are in solid lines. Increasing the cholesterol content increases hVDAC2 thermal stability in DMPC bicelles. (B) A comparison of the Tm and ΔHapp derived in all three bicelles with and without cholesterol (see foot of the figure for color/symbol code). With increasing cholesterol content, the Tm increases in DMPC and decreases in DPPC. The ΔHapp shows a modest nonlinear variation with increasing cholesterol content, suggesting that the PC lipid modulates hVDAC2 stability without affecting the unfolding cooperativity. Error bars represent the SD from two to three independent experiments. For 26% cholesterol samples, errors in Tm are high because of difficulties in bicelle preparation. DSPC bicelles containing >13% cholesterol could not be prepared. (C) A comparison of per-residue RMSF (top) and overall RMSF (bottom) of the transmembrane region of hVDAC2 in DPPC bilayers doped with increasing mole percent of cholesterol. The RMSF is lowest in DPPC without additional cholesterol. Note that the % cholesterol in (B) and (C) cannot be compared directly because they represent mole percent in (B), obtained with respect to the concentration of the long-chain lipid, and mole fraction in (C). See Materials and Methods and Table S2 for details. The complete data and additional results are presented in Figs. S17–S26. To see this figure in color, go online.

