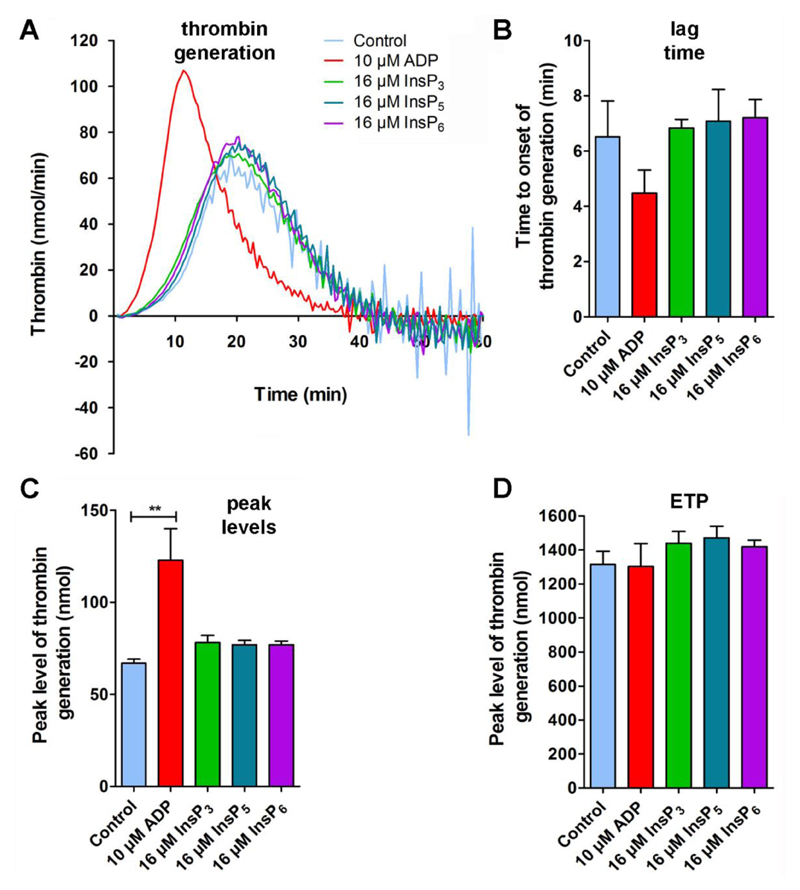
Fig. 7. InsPs do not enhance thrombin generation.
(A) PRP was incubated with either 16 μM InsP3 (green), InsP5 (dark blue), InsP6 (magenta) or with ADP (10 μM, red) for 10 min. Then, thrombin generation was initiated by addition of CaCl2 and tissue factor. Formation of thrombin was determined in quadruplicate by the calibrated automated thrombin generations assay (CAT) as described in the method section. Shown is one representative experiment out of three measurements. (B) The time to onset (lag time) and (C) the peak levels of thrombin generation were quantified by CAT in the indicated groups. (D) The endogenous thrombin potential (ETP, nmol) is a measure for the total thrombin generated within the sample. (B-D) Mean values ± SEM of three independent experiments (performed in quadruplicates) are shown. Statistically significant differences between groups were determined by one-way ANOVA (F (4, 9) =12, 49; p=0.001).

