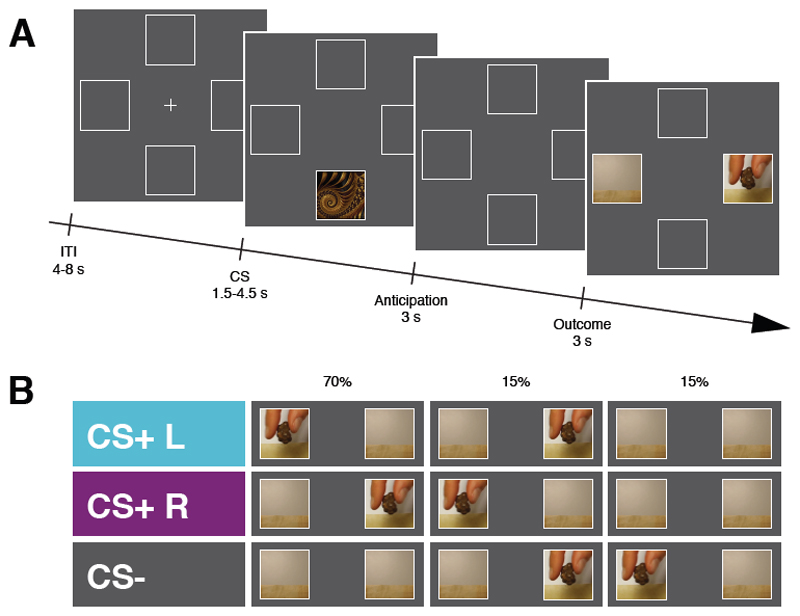
Figure 1. Schematic representation of the experimental design.
A, Illustration of the sequence of events within a trial for Experiment 1, Experiment 2 and Experiment 4. At the beginning of each trial a Conditioned Stimulus (CS) was presented randomly in the upper or the lower portion of the screen for 1.5 – 4.5 s (uniformly distributed). After an anticipation screen of 3 s, a video showing the snack delivery appeared either to the right or the left side of the screen for 3s. The inter-trial interval (ITI) lasted for 4 – 8 s (uniformly distributed). At the end of each session participants received the actual snacks delivered during the task to be consumed. B, In Experiment 1 trial involved one of three CS, each of which primarily predicted (70%) either the snack delivery to the left (CS+ L), the snack delivery to the right (CS+ R), or no snack delivery (CS-).

