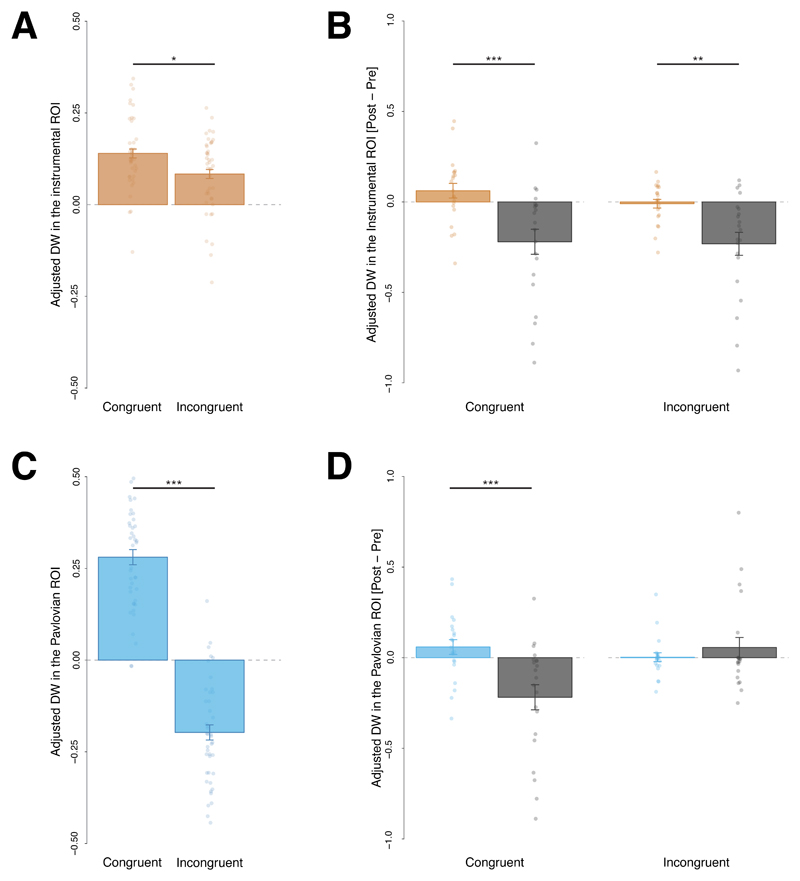
Figure 6. Illustration of the main effects during Experiment 3.
A, C, Adjusted Dwell Time (DW) spent in (A) the instrumental Region of interests (ROI) *F(1,41) = 5.41, p = .025, η2p = .117, 90% CI [.008, .272] and (C) the Pavlovian ROI ***F(1,41) = 133.61, p < .001, η2p = .765, 90% CI [.646, .824] during the action screen after the perception of a congruent or incongruent cue. B, D, Influence of the outcome devaluation procedure on the dwell time in these ROI for the satiation group that underwent the devaluation procedure and the control group that did not: Bars represent a change score in the dwell time induced by the outcome devaluation procedure (change score = dwell time in a specific ROI after satiation – dwell time in a specific ROI before satiation); ***F(1,40) = 12.02, p = .001, η2p = .231, 90% CI [.063, .393], **F(1,40) = 10.75, p = .002, η2p = .212, 90% CI [.051, .374]. Error bar represents the between subject standard error of the mean, all plots are based on data from 42 participants.

