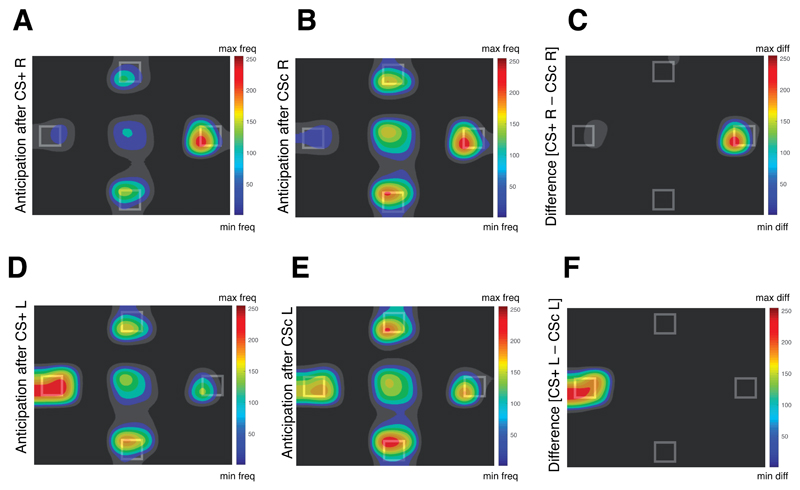
Figure 7. Effect of conditioning during Experiment 4.
A,B,D,E, Heatmaps of the fixation patterns during the anticipation screen (normalized frequency; freq) after the offset of the conditioned stimulus (CS) that predicted: the video of a hand delivering a snack to the right side of the screen (CS+ R; A); the video of an empty hand to the right side (CSc R; B); the video of a hand delivering a snack to the left side of the screen (CS+ L; D); the video of an empty hand to the left side of the screen (CSc L; E). C, F, Heatmaps of the normalized difference (diff) between the fixation pattern during the anticipation screen after the offset of the CS+ R and the offset of the CSc R (C) and after the offset of the CS + L and the offset of CSc L (F).

