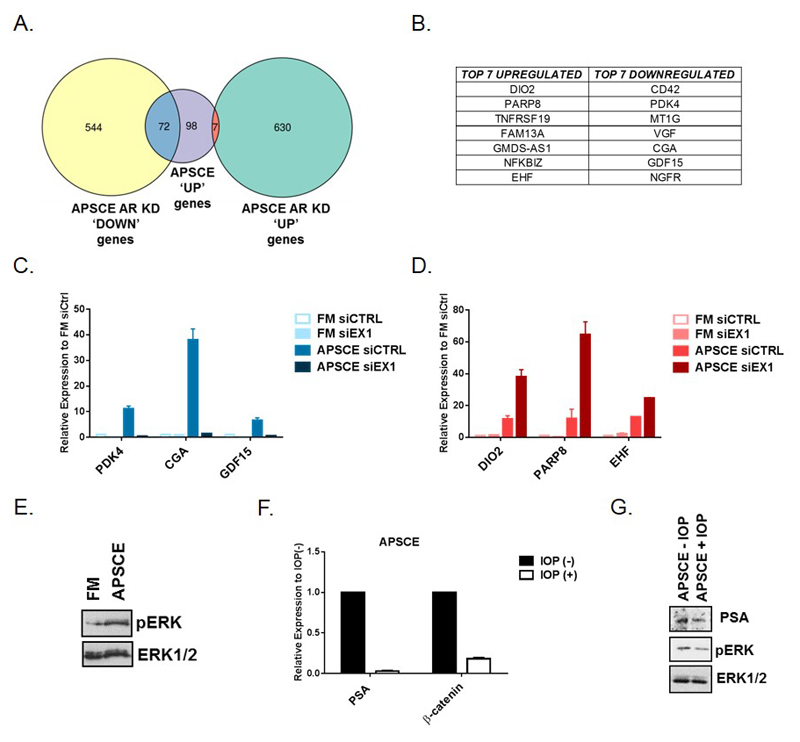
Figure 6. ‘APSCE identifies the thyroid hormone signalling network as a target to overcome castration resistance in prostate cancer’.
(A) Venn diagram demonstrating genes upregulated in APSCE and up- or down-regulated following AR depletion with siEX1 in APSCE in CWR22Rv1 cells.
(B) Top seven up- and down-regulated genes in the APSCE and following AR depletion with siEX1 in APSCE in CWR22Rv1 cells (where CGA, Chorionic Gonadotrophin subunit Alpha).
(C) Validation of up-regulated genes in the APSCE and following AR depletion with siEX1 by qPCR analysis of CWR22Rv1 cells after AR depletion with siEX1 in FM and APSCE. Data is represented as fold change of FM siCTRL experimental arm. Data represents at least three independent experiments ± SEM.
(D) Same as in (C) but validation for down-regulated genes.
(E) Western blot analysis measuring p-ERK expression in CWR22Rv1 cells cultured in FM and APSCE. Total ERK (ERK1/2) was used as loading control.
(F) Effect of DIO2 inhibitor, iopanoic acid (IOP, 50μM) for 24h on PSA and β-catenin expression in CWR22RV1 cells in APSCE.
(G) Western blot analysis measuring PSA and p-ERK expression following treatment of CWR22Rv1 cells with IOP (50μM) for 24h in APSCE. Total ERK (ERK1/2) was used as loading control.

