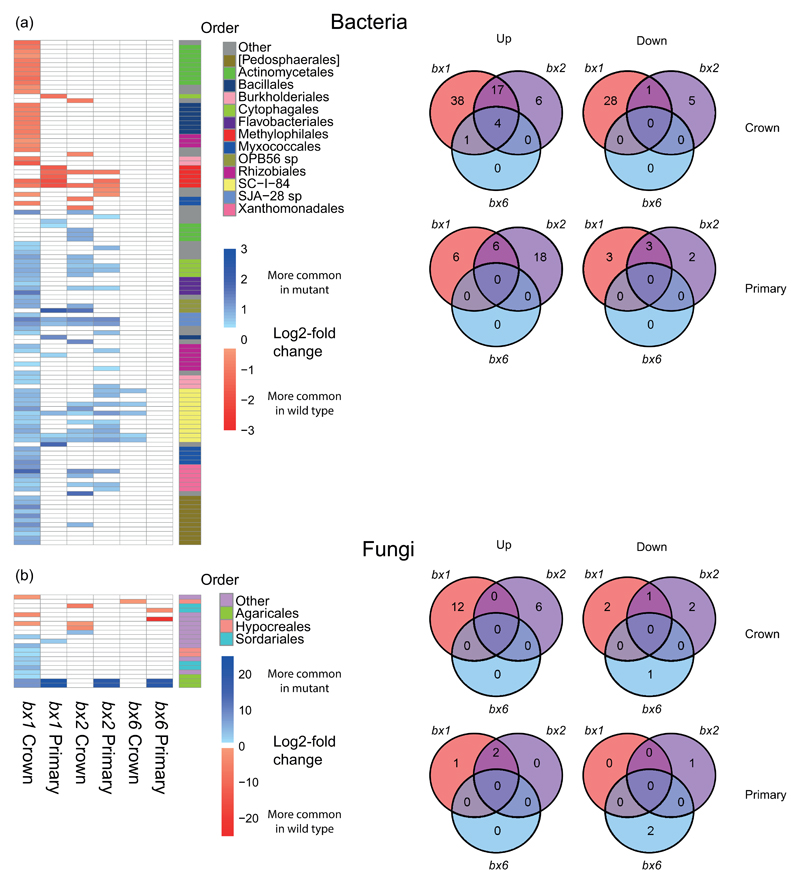
Figure 3.
Differences in bacterial (a) and fungal (b) operational taxonomic units (OTUs) between roots from WT and bx mutant plants. Heat map projections on the left represent Log2 fold changes in relative OTU abundance between the bx mutant and the WT (crown and primary). Shown are statistically significant values only (p ≤ 0.05, corrected for false discovery). Red indicates Bx-stimulated OTUs with greater abundance in the WT than the bx mutant; shown in blue are Bx-repressed OTUs with greater abundance in the bx mutant than the WT. Note the difference in scale between bacterial and fungal OTUs. Phylogenies are shown at the order level for taxa that are represented more than twice. Venn diagrams on the right show numbers of unique and overlapping OTUs that show a statistically difference in relative abundance between bx mutant and WT roots (crown and primary).

