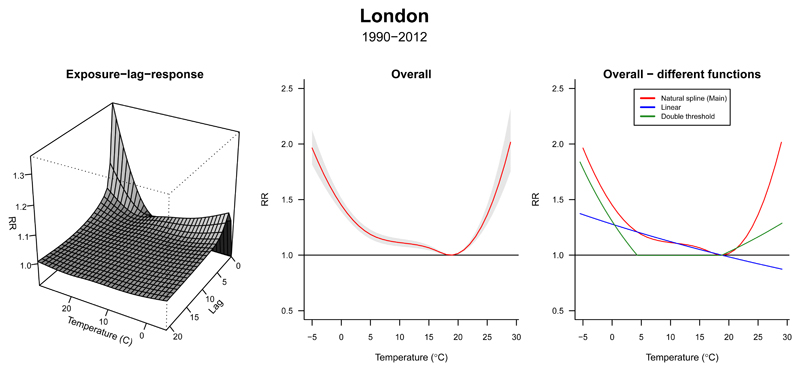
Figure 1. Temperature-related mortality in London (1990-2012).
Left panel: three-dimensional plot showing the estimated exposure–lag–response association between temperature and mortality. Mid panel: overall cumulative mortality risk (and 95% confidence interval). Right panel: comparison between the exposure–response shapes estimated using three modeling approaches.

