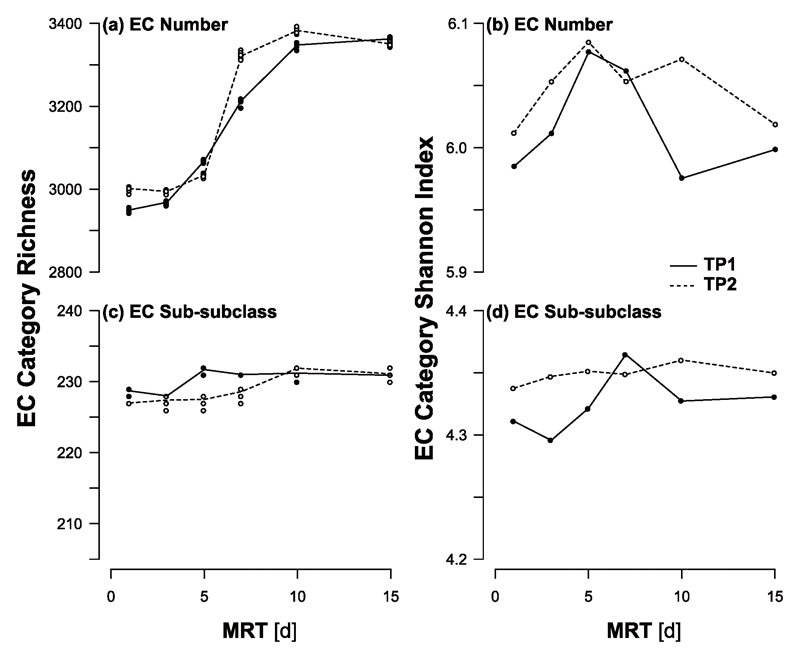
Figure 4.
The richness (a,c) and Shannon diversity (b,d) values for the reaction-type annotated RNA data binned into Enzyme Commission (EC) number (a,b) and sub-subclass (c,d) for TP1 (solid) and TP2 (dashed) with a fractional abundance cutoff of 10-7. These diversity values were calculated for each reactor using the rtk v0.2.5.4 package in R v3.5.1 for (a,c) 10 bootstrap sub-selections of the annotations or (b,d) the full data. The lines trace the (a,c) bootstrap mean or (b,d) calculated value.

