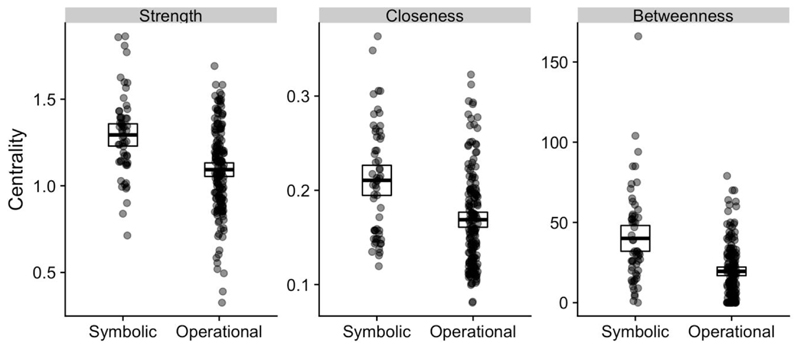
Figure 1.
Symbolic components (n = 56) are higher in strength, closeness, and betweenness centrality than operational components (n = 162) across the seven belief system networks. Higher values imply higher centrality. Points represent individual nodes from networks estimated from all seven waves of data (visualized in Figures S1 and S2). Points are horizontal jittered to improve clarify. Top and bottom edges of the boxes represent upper and lower bounds of the 95% confidence interval of the mean. The centerline of the box represents the mean. Closeness was multiplied by 100 before plotting to reduce the number of leading zeros.

