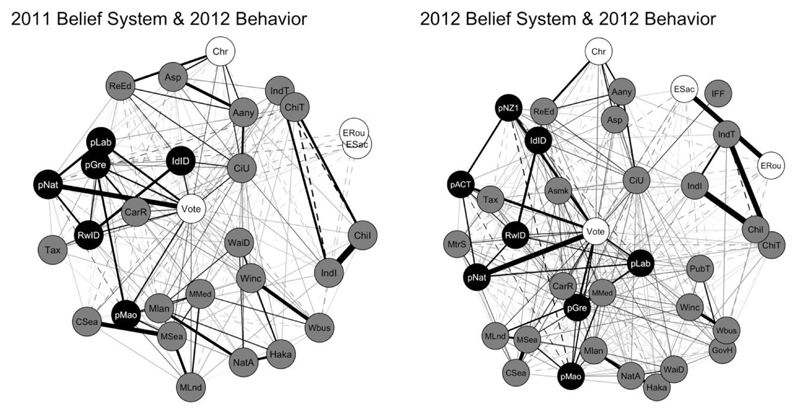
Figure 2.
Belief system networks with symbolic (black nodes), operational (gray nodes), and behavioral (white nodes) components. Solid edges are positive. Dashed edges are negative. Thicker edges represent stronger connections between nodes. Placement of the nodes is determined with multidimensional scaling of the absolute value of the adjacency matrix (Jones, Mair, & McNally, 2018). Node labels are described in Table 1.

