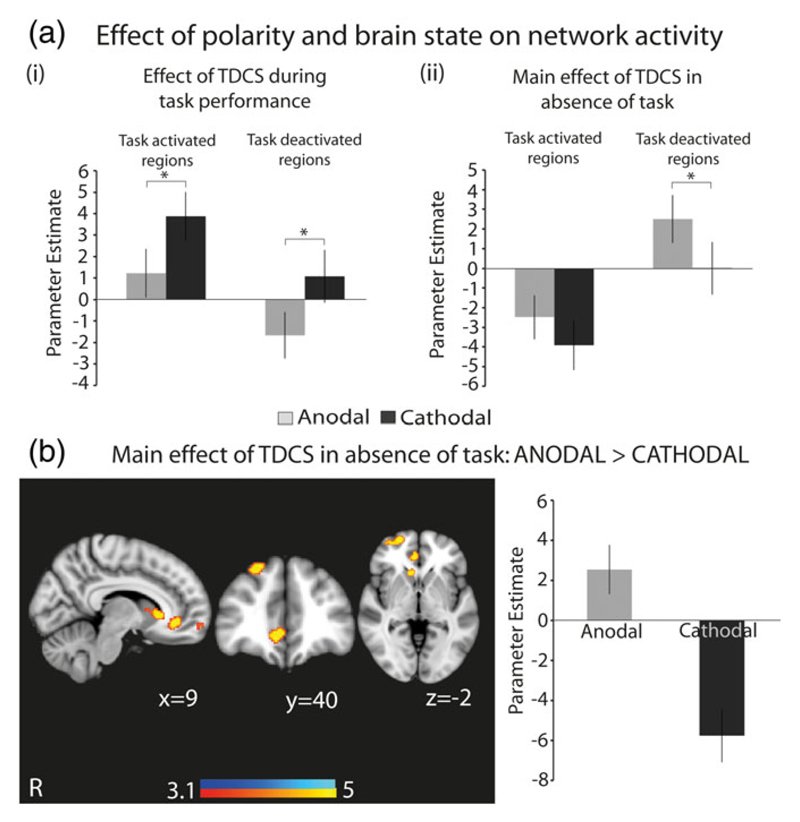
Figure 4.
An interaction between polarity and brain state on network activation. (a) Graphs showing changes in BOLD activity in task-related networks under anodal and cathodal tDCS during (i) “rest” and (ii) CRT performance. “Task-activated regions” refers to the areas showing increased activation, and “task-deactivated regions” refers to areas showing decreased activation, during CRT performance, as shown in Figure 2a. (b) Overlay of brain areas showing greater activation with anodal tDCS, compared with cathodal tDCS, in the absence of task. The accompanying bar chart shows mean activation in the overlaid regions under anodal and cathodal tDCS, and is provided to demonstrate the increase in BOLD activity under anodal tDCS and decrease in BOLD activity under cathodal tDCS. Results are superimposed on the MNI152 1 mm brain template. Cluster corrected z = 3.1, p < .05. Bar charts denote mean values, error bars are SEMs, * denotes p < .05 [Color figure can be viewed at wileyonlinelibrary.com]

