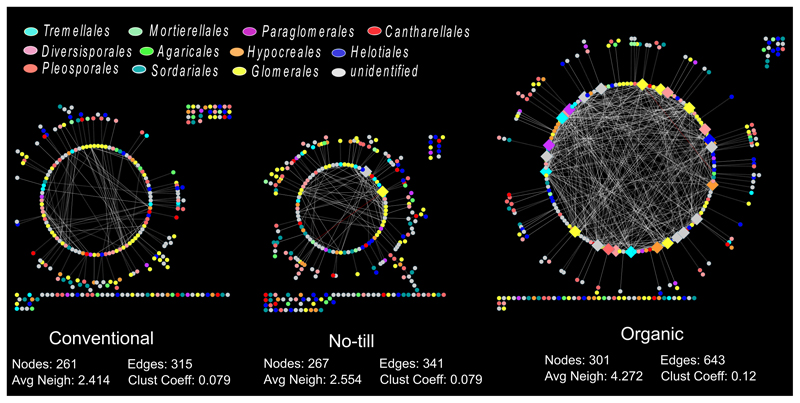
Figure 3.
Farming system specific root fungal networks. Each network was generated with root samples collected from 20 farmlands belonging to that farming system. The number of nodes, number of edges, average number of neighbors, and clustering coefficient is given below the specific networks. Large diamond nodes indicate the keystone taxa whereas circular nodes indicate other taxa in the network. White, red and wavy lines represent positive, negative and non-linear relationships, respectively. Despite having similar number of nodes, the organic network displayed twice more edges and many highly connected nodes than no-till and conventional networks that were dominated by less connected peripheral nodes.

