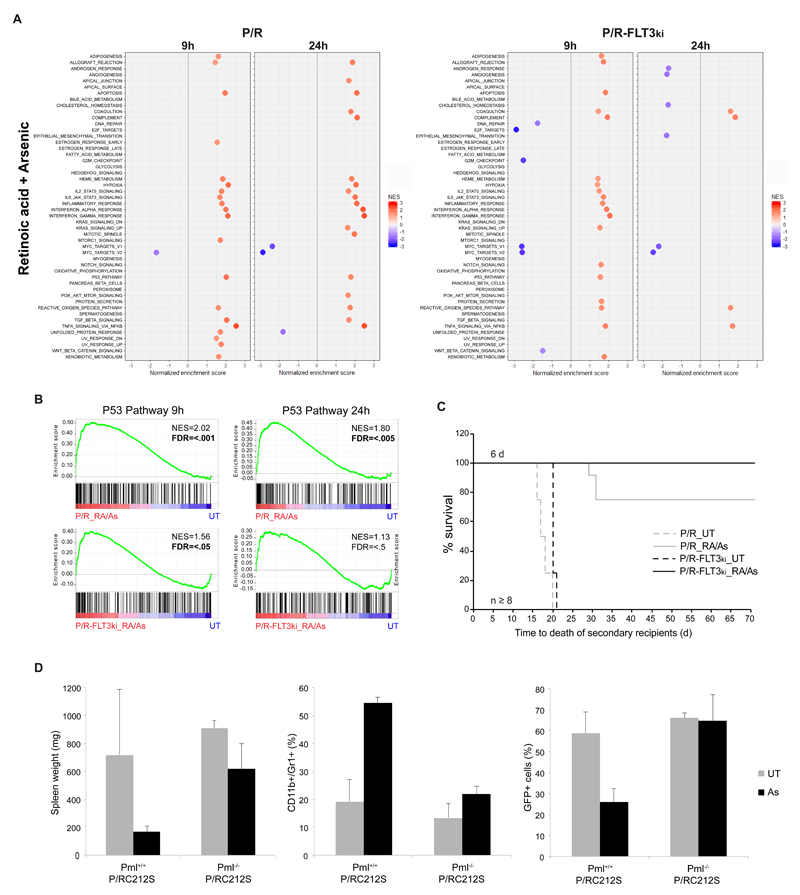
Figure 6. Combined ATRA/As treatment overcomes FLT3-ITD-triggered resistance.
(A) GSEA analysis for 50 hallmark gene sets between P/R and P/R-FLT3ki mice treated during 9 hours or 24 hours with ATRA/As. Only significant pathways were represented (with FDR.q.val < 0.05) according to NES value. (B) GSEA analysis of the p53 pathway in P/R and P/R-FLT3ki mice treated during 9 hours or 24 hours with ATRA/As. NES (Normalized Enrichment Score) and FDR are noted. FDRq.val < 0.05 are in bold. (C) Survival of secondary recipients transplanted with APL bone marrow cells from ATRA/As 6-d-treated primary APL mice in both models (n ≥ 8 for each model). (D) Comparison of spleen weight (left), differentiation (CD11+/Gr1+, middle) and blast clearance (GFP+, right) of untreated (UT) or As 7-d-treated APL mice with MRP8-PML/RARAC212S in Pml+/+ or Pml-/- genetic background. Data are expressed as mean ± s.d. of at least 2 independent experiments.

