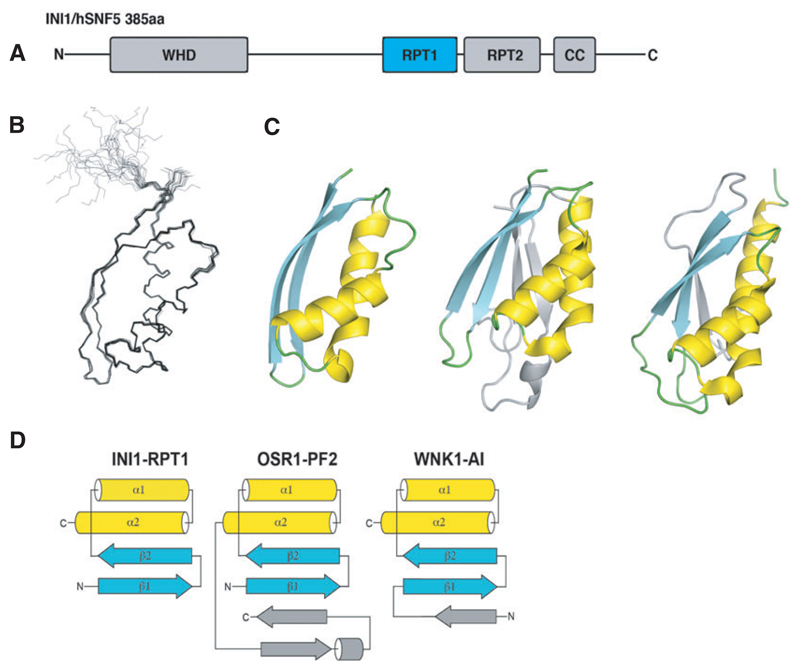
Fig. 1.
Structure of INI1/hSNF5 RPT1. (A) Representation of the domain structure of INI1. (B) Overlay of the 20 lowest energy NMR structures of RPT1. (C) From left to right: cartoon representations of the X-ray structure of RPT1, and the structures of the OSR1 CCT domain and the autoinhibitory domain of WNK1 (WNK1-AI). (D) Schematic of the topologies of the INI1/hSNF5 RPT1, OSR1 CCT, and WNK1-AI domains.

