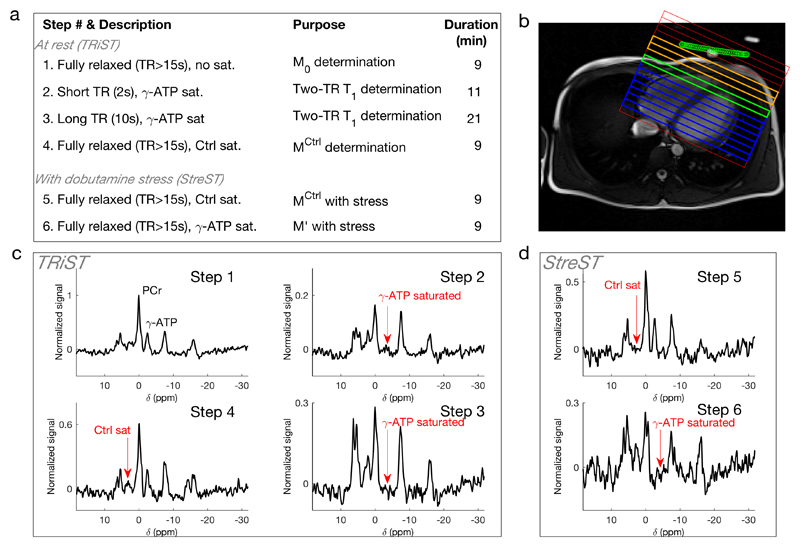
Figure 1.
a Six-step StreST protocol (including TRiST as steps 1-4). b 1H localiser with 1D CSI grid overlaid. The coil position is marked in green. Orange = Skeletal muscle, Blue = myocardium, green = Most anterior myocardial slice (coil slice distance < 60 mm). c Spectra acquired from the 4 steps of TRiST on a healthy, normal-weight subject. d Spectra acquired during dobutamine stress as part of the extension StreST measurement. In c&d signal is normalised to the PCr peak value in step 1.

