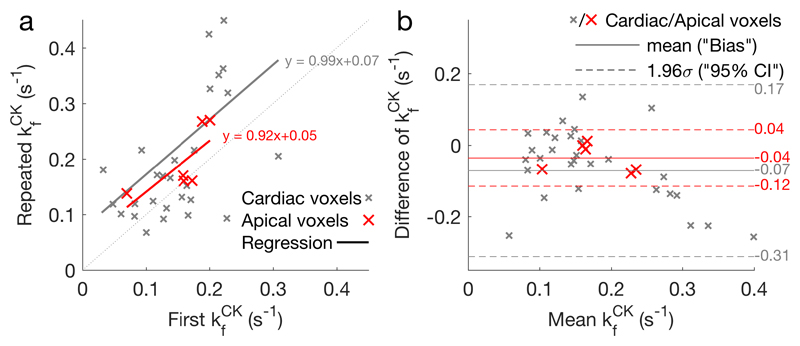
Figure 5.
a Per-slice correlation plot of the two kfCK measurements in StreST (1st measurement equivalent to TRiST). All myocardial slices are shown, with the most apical cardiac slice for each subject shown in red. Results of linear regressions are also shown. b Bland-Altman comparison of the two kfCK measurements. The bias and 95% confidence intervals for each set of slices (all cardiac & apical) are marked.

