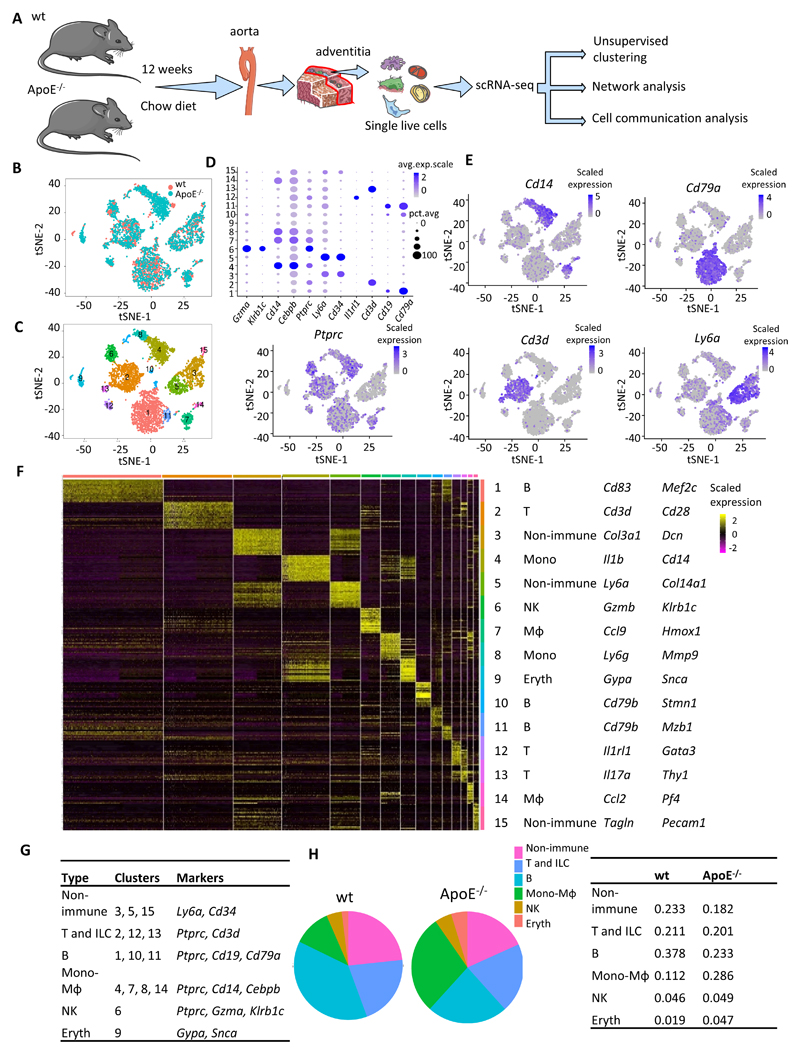
Figure 1. Identification of main cell clusters in the adventitia of male wt and ApoE-/- mice.
(A) Schematic graph of single-cell RNA-sequencing and data analysis pipeline. (B) t-SNE plot of adventitial cells from wt and ApoE-/- mice. Colors denote different genotypes. (C) t-SNE plot of adventitial cells with colors denoting cluster number. (D) Dot plot of selected marker genes for each cluster. (E) Feature plot of markers defining major cell types. (F) Heatmap of the top 20 (by average log(fold change)) marker genes from each cluster and cell type assignment of each cluster. Full list of markers is in Supplemental table II. (G) Cluster and major cell type correspondence. (H) Fraction of each cell type in wt and ApoE-/- adventitial cells. Avg.exp.scale, average scaled expression; pct.exp, percentage of expressing cells; tSNE, t-distributed stochastic neighbor embedding; ILC, innate lymphoid cells; Mono, monocytes; MΦ, macrophage; Eryth, erythrocytes.

