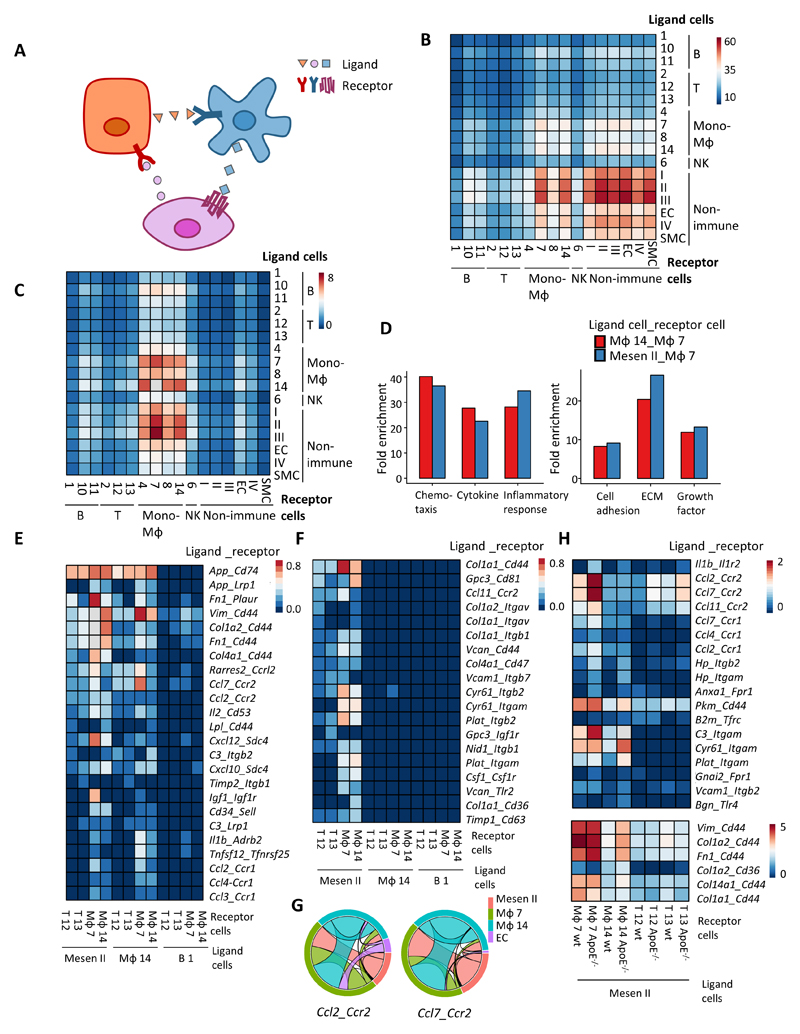
Figure 6. Mesen II cells interact with immune cells.
(A) Illustration of cell-cell interaction analysis. Ligand is from one cell (same color as the cell) and interacts with receptor from another cell. (B) Mean interaction numbers between cell types from ApoE-/- adventitia. Rows represent ligand cells and columns represent receptor cells. (C) Mean interaction numbers of ligands and receptors from the GO inflammatory response gene set between cell types from ApoE-/- adventitia. Rows represent ligand cells and columns represent receptor cells. (D) Gene set enrichment analysis (UniProtKB Keywords) of the ligands from the top 200 (mean number of interaction) ligand-receptor pairs of ligand cell type (resident MΦ 14 and Mesen II) and receptor cell type (inflammatory MΦ 7). (E) Heatmap of mean interaction numbers of specified ligand-receptor pairs between specified cell types from ApoE-/- adventitia. (F) Heatmap of mean interaction numbers of specified ligand-receptor pairs between specified cell types from ApoE-/- adventitia. (G) Interaction of Ccl2 and its receptor Ccr2, Ccl7 and its receptor Ccr2 between ApoE-/- Mesen II, inflammatory macrophages (MΦ 7), resident macrophages (MΦ 14) and adventitial ECs (Adv-EC) from ApoE-/- adventitia. The same color of link with the cluster indicates that cells from this cluster contribute to the interaction as ligand. (H) Heatmap showing the comparison of mean interaction numbers of specified ligand-receptor pairs between Mesen II and specified cell types from wt and ApoE-/- adventitia. Mesen, mesenchyme; EC, endothelial cell; SMC, smooth muscle cell; wt, wild-type.

