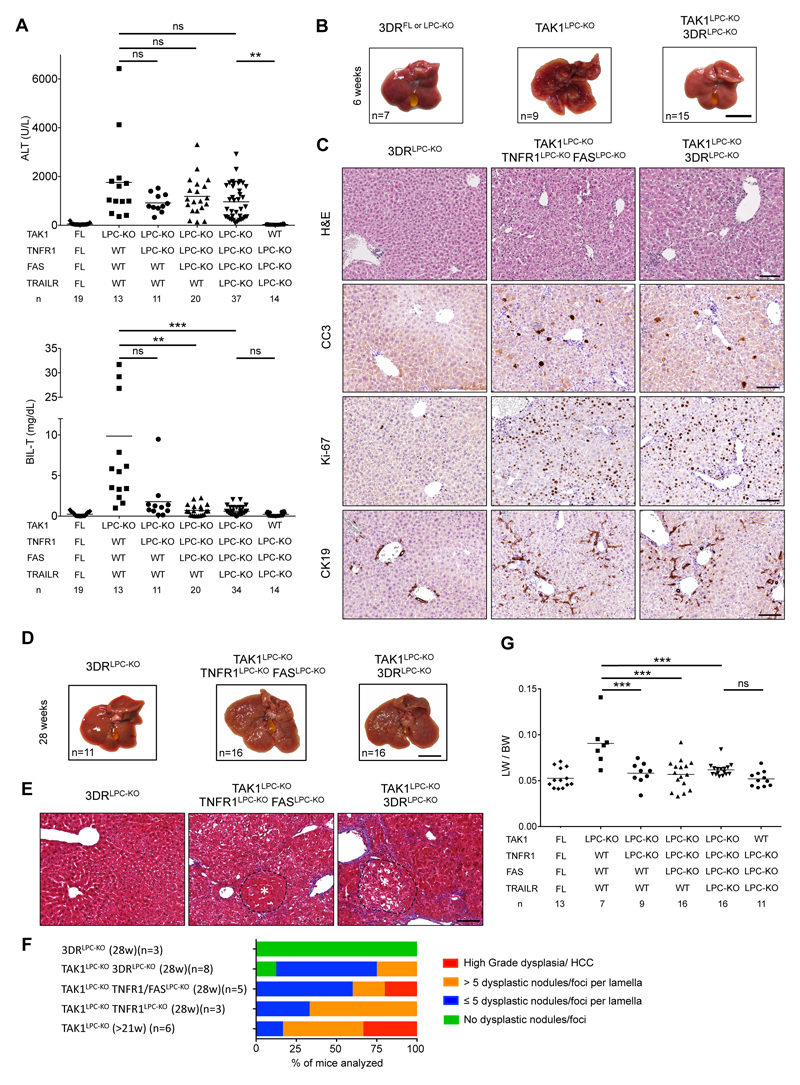
Fig. 7. Death receptor signaling drives biliary but not hepatocellular damage, and significantly delays hepatocarcinogenesis in TAK1LPC-KO mice.
(A) Serum levels of ALT and total Bilirubin in 6-week-old mice with the indicated genotypes. (B) Representative liver images from 6-week-old animals with the indicated genotypes. (C) Representative images of liver sections from 6-week-old mice with the indicated genotypes stained with H&E or immunostained for CC3, Ki-67 and CK19. (D-E) Representative liver photos (D) and images of liver sections stained for Masson’s trichrome (E) from 28-week-old mice with the indicated genotypes. Dysplastic nodules are outlined and marked with an asterisk. (F-G) Histopathological evaluation of hepatocarcinogenesis (F) and LW/BW ratio (G) in 28-week-old mice with the indicated genotypes. The number of mice analyzed (n) is indicated in every graph. All graphs show mean values of the individual data points. *p <0.05, **p <0.01, ***p <0.005. Bars: (B,D) 1 cm; (C,E) 100 μm.

