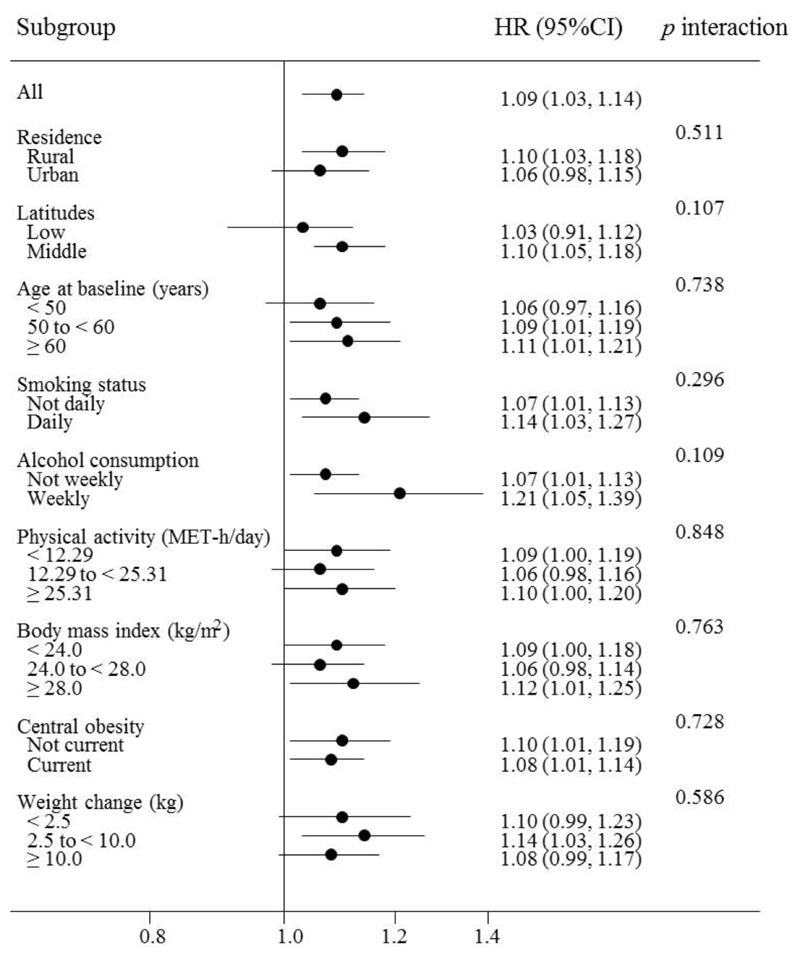
Fig. 2.
Subgroup analysis of the association between season of birth and the risk of type 2 diabetes in adulthood among the whole cohort according to potential baseline risk factors. Horizontal lines represent 95% CIs. HRs and 95%CIs are for comparison of combined category of Spring-, Autumn-, and Winter-born participants with Summer-born. Multivariable model was adjusted for: age; sex; level of education; marital status; alcohol consumption; smoking status; physical activity; intake frequencies of red meat, fresh fruits, and vegetables; family history of diabetes; and BMI at baseline. The tests for interaction were performed using likelihood ratio tests, which involved comparing models with and without cross-product terms between the baseline stratifying variable and the season of birth. Subgroup analysis according to weight change since 25 years: N=386,753.

