Fig. 3.
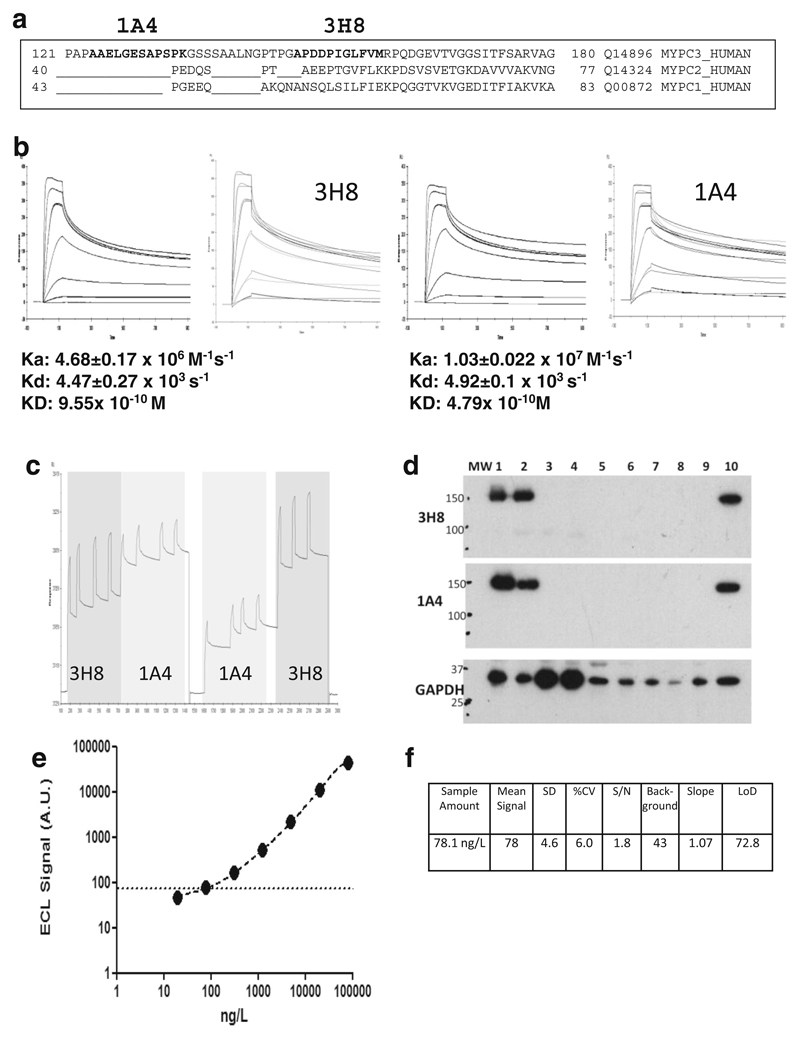
The development of a quantitative immunoassay for human cMyC in serum. a Sequence alignment of cMyC with skeletal myosin binding protein C isoforms. The sequence recognised by monoclonal anti-cMyC antibodies 1A4 and 3H8 are shown in bold. The antibodies bind to cardiac-restricted sequences with organ specificity further verified by immunoblots (see d). b SPR kinetic sensorgrams demonstrating the kinetic parameters of clone 3H8 (left) and 1A4 (right). These antibodies were selected from over 50 hybridomas, and both antibodies are of high affinity. c Epitope competition sensorgram of 1A4 and 3H8 binding to the C0C2 region of cMyC conjugated to a CM5 biosensor chip. Although antibodies recognise near adjacent epitopes, there is no appreciable interference between them. Near adjacency is needed since cMyC is fragmented in the circulation raising the possibility of separation of capture and detection epitopes if they were widely spaced. d Immunoblot of rat and human tissue demonstrating specificity of 3H8 and 1A4 monoclonal antibodies. GAPDH was used as a loading control. Samples 1–9 are various rat tissue (1 = ventricle, 2 = atria, 3 = rectus abdominus, 4 = soleus, 5 = spleen, 6 = kidney, 7 = aorta, 8 = liver, 9 = brain) and 10 is human ventricle. e Representative C0C2 standard curve from cMyC ECL assay indicating the limit of detection (dashed line). This in-house assay on a MesoScale Discovery enhanced chemiluminescent detection platform was used to measure cMyC appearance and disappearance in Figs. 2 and 3 below. Panel (f) demonstrates the performance characteristics of the assay, with a LoD of approximately 80 ng/L. Figures and legend reproduced from Baker et al. [22]

