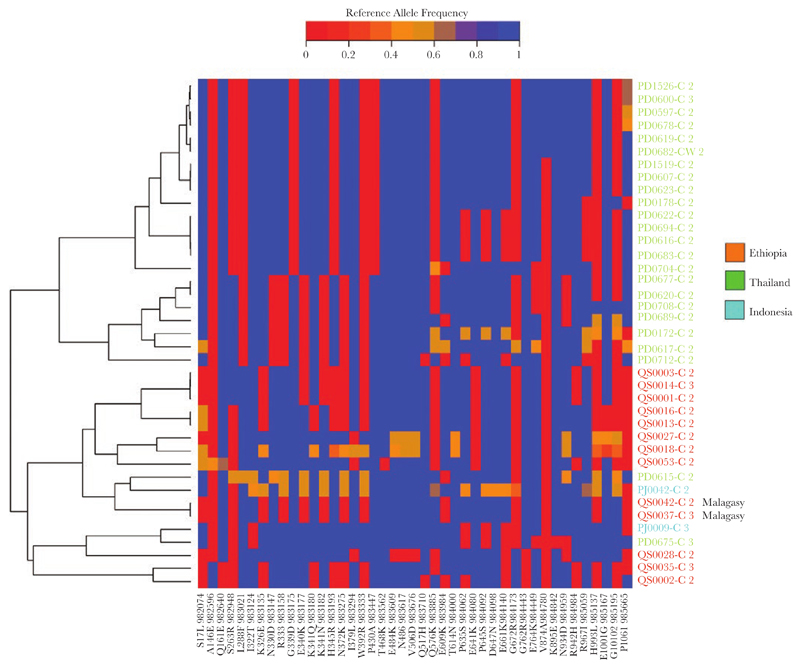
Figure 5.
Heatplot illustrating multiple Duffy binding protein 1 (DBP1) haplotypes between samples and divergence between DBP1 copies within samples in monoclonal infections with copy number amplifications. The heat plot presents color-coded genotype calls at single-nucleotide polymorphisms in the DBP1 gene with minor allele frequency ≥1%. Genotypes are presented as reference allele frequencies ranging from 0 in red (homozygote alternative allele) to 1 in blue (homozygote reference allele). Samples are ordered on the y-axis according to their genetic relatedness as per the left-hand phylogram. Sample labels are color-coded according to country. Only monoclonal (within-sample F statistic > 0.95) infections with ≥2 DBP1 copies were included in the analyses. Therefore, heterozygous positions (in orange) reflect differences between the DBP1 copies within a given infection. Two Malagasy-type DBP1 amplifications are labeled; all other amplifications were Cambodian type.

