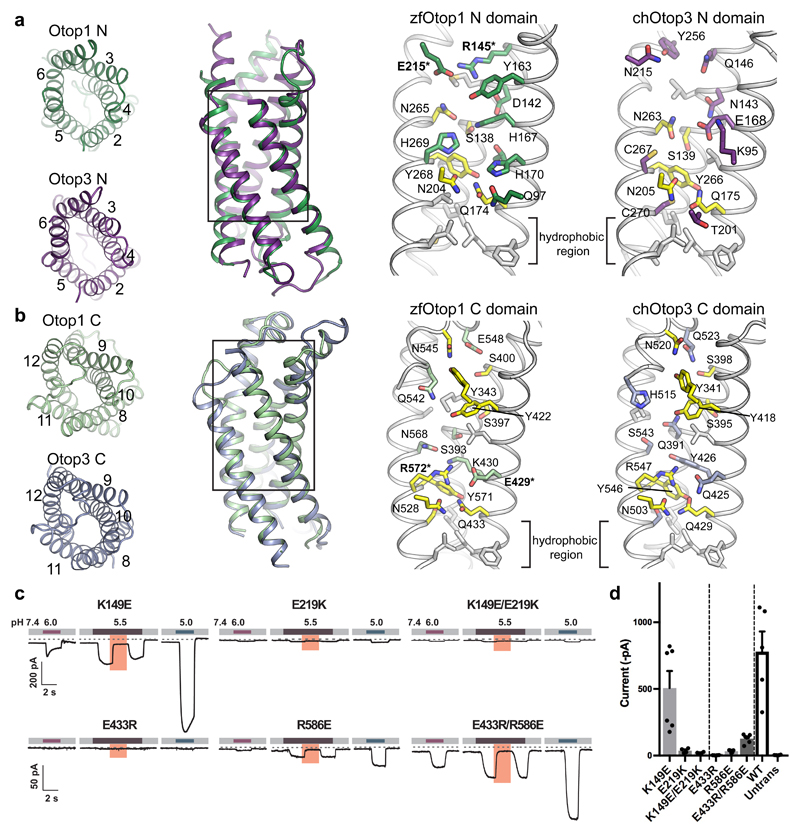
Figure 3. N and C domain vestibules Otop1 and Otop3.
a, various views of Otop1 N domain and Otop3 N domain. Top views in which TM1 is omitted (far left panels) are shown, as well as side view (middle left) of the aligned N domains of Otop1 (green) and Otop3 (purple). Middle right and far right panels show expanded views, with residues conserved between Otop1 and Otop3 colored yellow. b, various views of Otop1 and Otop3 C domains, with panels arranged as in a. TM7 is omitted from the top views. In both a and b, residue numbering refers to zebrafish Otop1 and chicken Otop3. c, currents measured by whole-cell patch clamp recording in HEK-293 cells expressing each mouse Otop1 mutant in response to acidic extracellular solutions with pH indicated (pHi = 7.4, Vm = –80 mV). The currents elicited in response to pH 5.5 were inhibited by 1 mM Zn2+ (pink bars). Numbering is according to the mouse Otop1 sequence. The residues in zfOtop1 that are equivalent to those mutated in mOtop1 are bolded and marked with an asterisk in panels a and b (K149 in mOtop1 corresponds to R145 in zfOtop1; E219 = E215; E433 = E429; R586 = R572). d, averaged current magnitude in response to pH 5.0 from experiments as in the left panel. Individual data points, means and s.e.m are shown, for K149E (n=6 cells), E219K (n=4), K149E/E219K (n=4), E433R(n=4), R586E(n=4), E433R/R586E (n=6), WT (n=5), and untransfected (n=4). Current magnitudes for K149E/E219K were not significantly different compared to E219K (P=0.17, but they were significantly smaller compared with K149E (P=0.013, two-tailed Student’s T-test). Currents magnitudes for E433R/R586E were significantly larger as compared with E433R and R586E (P= 0.0003 and P=0.0006, respectively, by two-tailed Student’s T-test).

