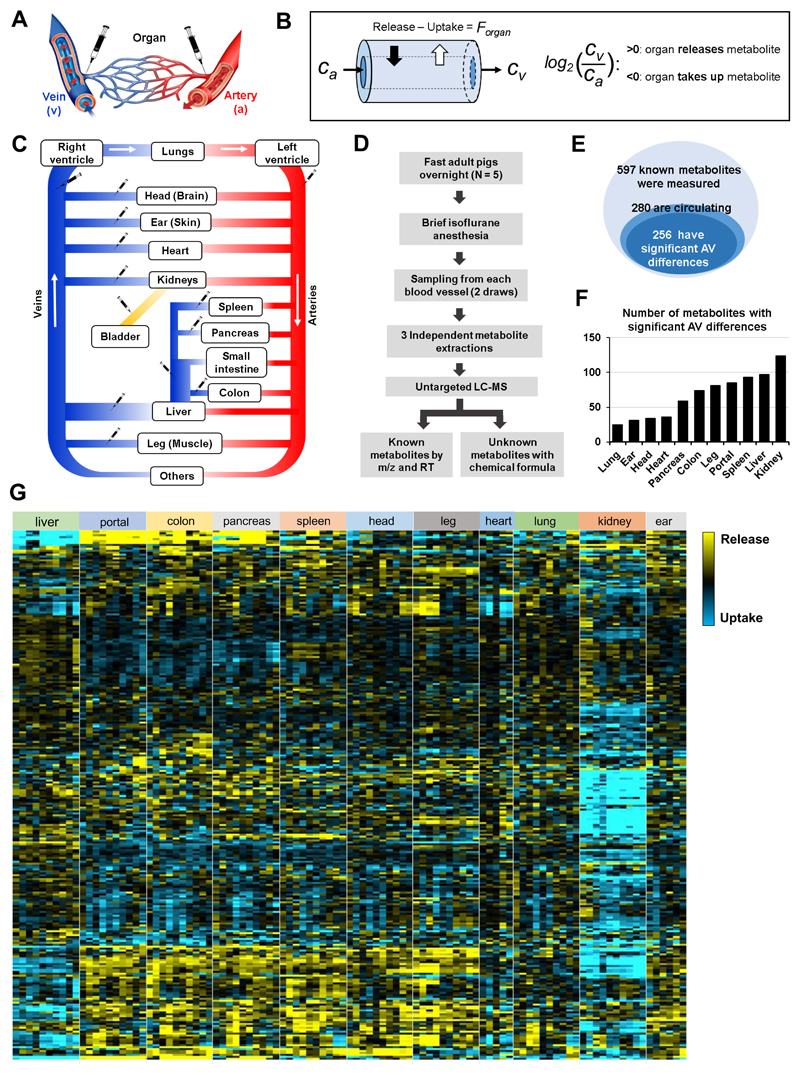
Fig. 1. The landscape of metabolite exchange between organs.
(A) AV difference measurements were achieved by sampling blood from the arterial circulation and organ-specific draining veins of fasting, anesthetized pigs. (B) The difference between metabolite production and consumption by an organ (the net flux, Forgan) results in enrichment or depletion of the metabolite in the exiting venous blood relative to entering arterial blood (concentrations Cv and Ca). This concentration difference is measured by LC-MS and reported as a log fold change. (C) Schematic of the circulatory system. Syringes indicate blood sampling sites. (D) Workflow. (E) Venn diagrams of measured metabolites, circulating metabolites, and metabolites with significant AV differences. (F) Number of metabolites with significant AV differences for each organ. (G) Heat map of AV differences of circulating metabolites across organs. Yellow indicates release and blue indicates uptake. Each data point indicates median of three technical replicates, with independent duplicate blood draws from the same pig shown separately (N = 5 pigs and 10 data points for most organs; only a single blood draw per pig was performed in the heart and only 3 pigs were used for the ear vein sampling). Leg, head, and ear primarily reflect skeletal muscle, brain, and skin metabolism, respectively. See also Figures S1, S2, and Data Files 1-3.

