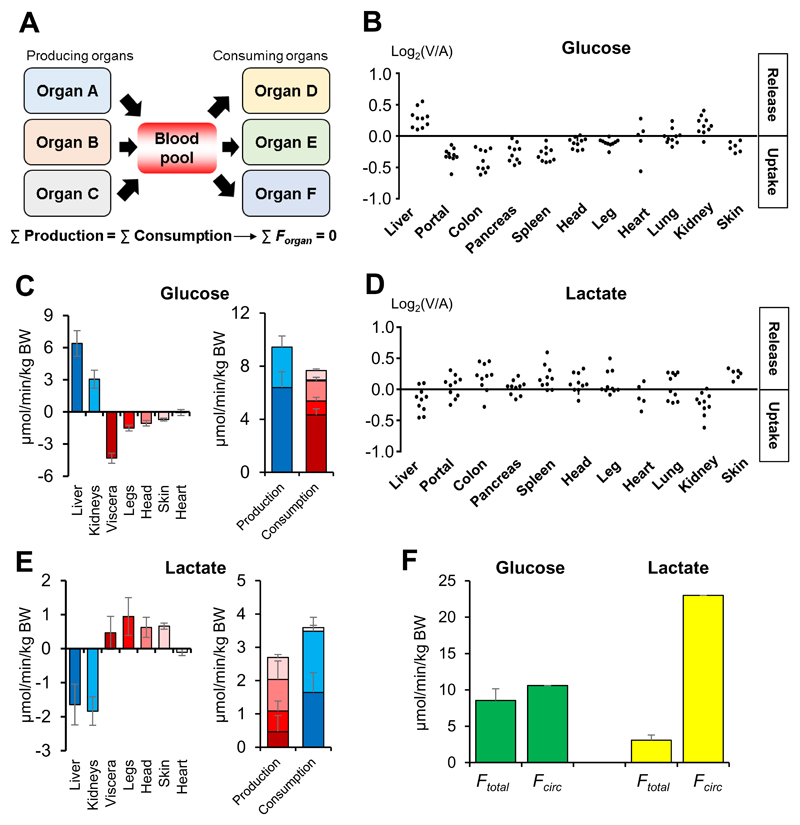
Fig. 3. Glucose production localizes to the liver and kidneys, whereas lactate production is distributed throughout the body.
(A) Metabolite production and consumption across all organs must balance to maintain circulating metabolite homeostasis. (B, D) Glucose and lactate show the opposite exchange patterns. Each data point reflects an independent venous blood draw from pig. (C, E) Production and consumption fluxes of glucose and lactate in pigs. (F) Comparison between sum of organ production fluxes (Ftotal) and whole body production rate (Fcirc) of glucose and lactate in pigs. Note that Ftotal and Fcirc are similar for glucose but different for lactate, indicating simultaneous lactate production and consumption within the same organ. Data are means and error bars are standard errors (N = 5 pigs, except for isotope tracing, which was performed in a single pig). BW, body weight; Viscera, organs feeding into the hepatic portal vein. See also Figure S4.

