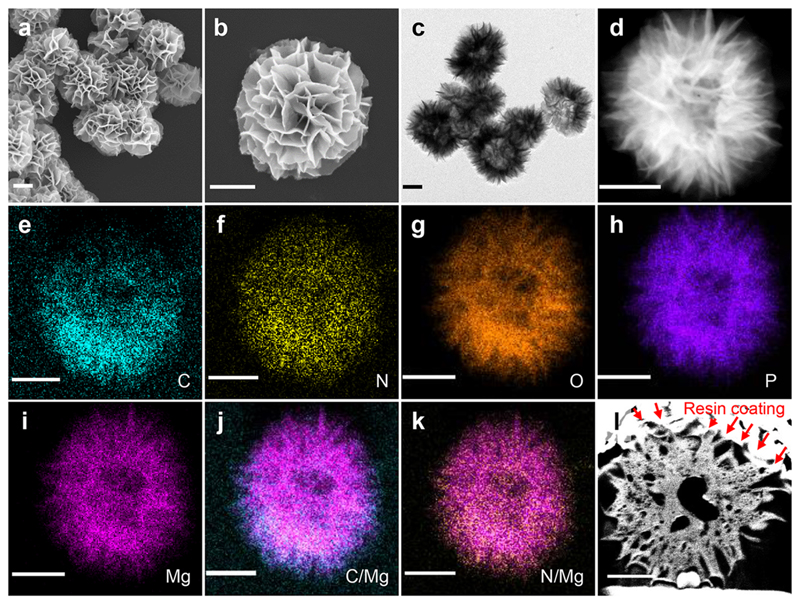
Figure 2.
Characterization of the hRNFs. Representative (a, b) SEM images, (c) TEM image, (d) HAADF-STEM image, (e–i) STEM-EDS elemental maps (C, N, O, P, and Mg) corresponding to d, merged images of (j) C and Mg maps, (k) N and Mg maps, and (l) SEM image of the orthogonal cross-section of a single hRNF sliced by FIB. Scale bars: 500 nm.

