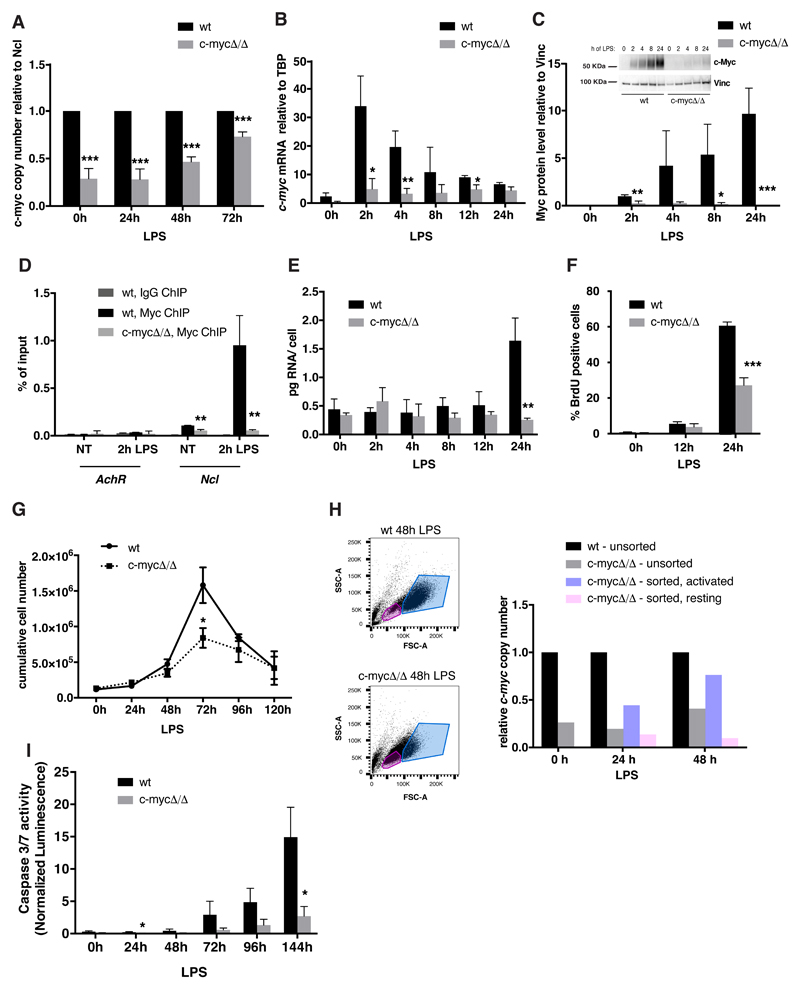
Fig. EV1. Characterization of c-mycwt/wt and c-mycΔ/Δ cells.
A. c-myc copy number relative to a reference amplicon on the Ncl gene at different time points after LPS stimulation in c-mycwt/wt and c-mycΔ/Δ cells, as indicated. n = 6 for the t0 and 24h samples, n=4 for the 48h and 72h samples.
B. c-myc mRNA expression (normalized to TBP) at different time points after LPS stimulation in c-mycwt/wt and c-mycΔ/Δ cells. n = 3.
C. Myc protein levels at different time points after LPS stimulation in c-mycwt/wt and c-mycΔ/Δ cells, based on quantification of four independent immunoblots (each produced with B-cell lysates obtained from a pool of 3 mice per genotype): a representative blot is shown above the plot. Note that in wild-type cells, c-myc mRNA levels peaked 2 hours after LPS stimulation[9] while the protein steadily accumulated over time, consistent with post-transcriptional regulation of its synthesis and/or stability [62,63]: as expected, both mRNA and protein accumulation were blunted in c-mycΔ/Δ cells.
D. Myc and IgG ChIP, as indicated, in non-treated (NT) or LPS-treated (2h) c-mycwt/wt and c-mycΔ/Δ B-cells. PCR primers in the AchR promoter (as a non-bound control) and in Ncl intron 1 (as a known Myc target with 5 E-boxes) were used for quantification (% if input) as previously described [39,64]. n = 3.
E. Quantification of total RNA levels per cell along the LPS time-course in c-mycwt/wt and c-mycΔ/Δ cells. n = 3.
F. Percentages of BrdU positive cells at 0, 12 and 24h, as indicated. n = 3.
G. Growth curve of c-mycwt/wt and c-mycΔ/Δ cells, as indicated. n = 3.
H. c-mycwt/wt and c-mycΔ/Δ cells were sorted according to their size and shape (FSC and SSC, respectively) after 24 or 48h of LPS stimulation: cells with low and high FSC+SSC were defined as resting and activated, respectively, and were purified by FACS sorting prior to qPCR quantification of c-myc copy number, alongside unsorted c-mycΔ/Δ and c-mycwt/wt control samples. Results from a representative experiment are shown. The experiment was repeated twice with similar results.
I. Caspase-3/7 activity normalized on cell numbers along the LPS time-course in c-mycwt/wt and c-mycΔ/Δ cells. n = 3.
Data information: In all the bar plots (except panel H), data are presented as mean ± SD. *P < 0.05, **P < 0.01, ***P < 0.001, Student’s t-test.

