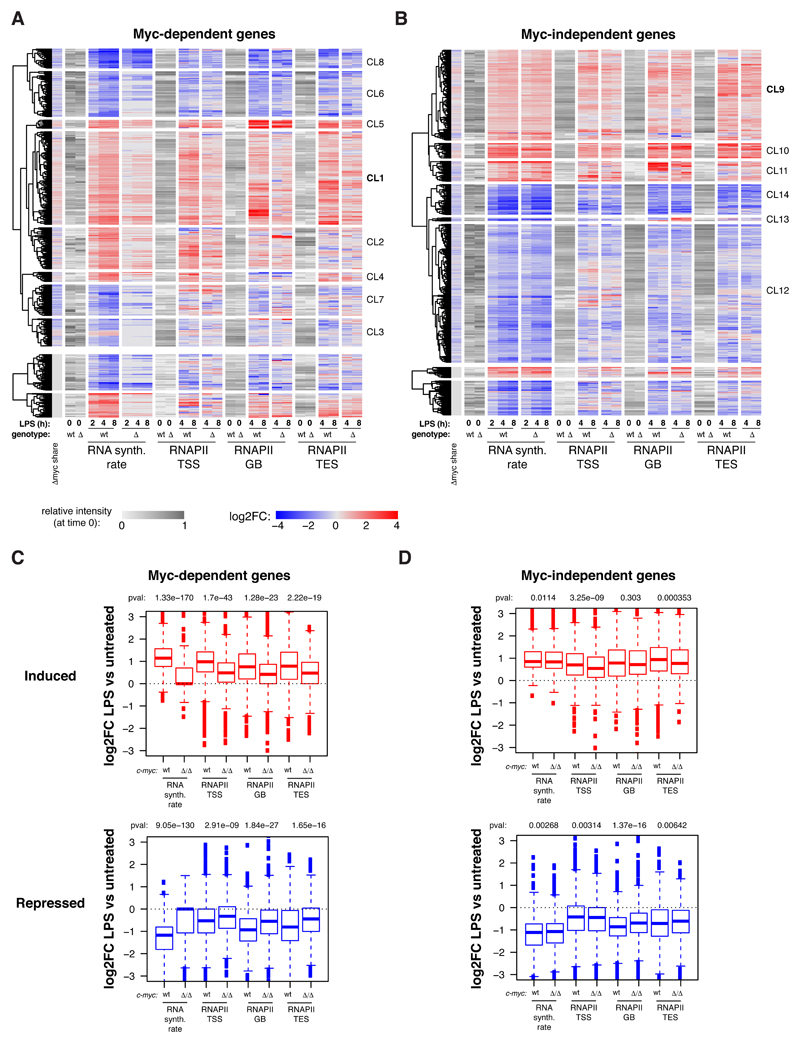
Fig. EV3. RNAPII ChIP-seq data quantification.
A, B. Heatmap showing the variations in RNAPII ChIP-seq read density (log2FC) in different regions (TSS, gene body, TES) for Myc-dependent (A) and Myc-independent (B) genes along the LPS time course, as indicated. The grey scale represents the starting level for each parameter in unstimulated cells. Columns on the left show the changes in Myc share and RNA synthesis, as indicated, rates for the same genes.
C, D. Boxplots reporting LPS-induced changes (Log2FC) for each of the four RNAPII kinetic rates in c-mycwt/wt (wt) and c-mycΔ/Δ cells for Myc-dependent (C) and Myc-independent (D) induced and repressed genes, as indicated. All boxplots are as defined in Fig. 2I, and RNAPII replicates as defined in Fig. 4B,C.

