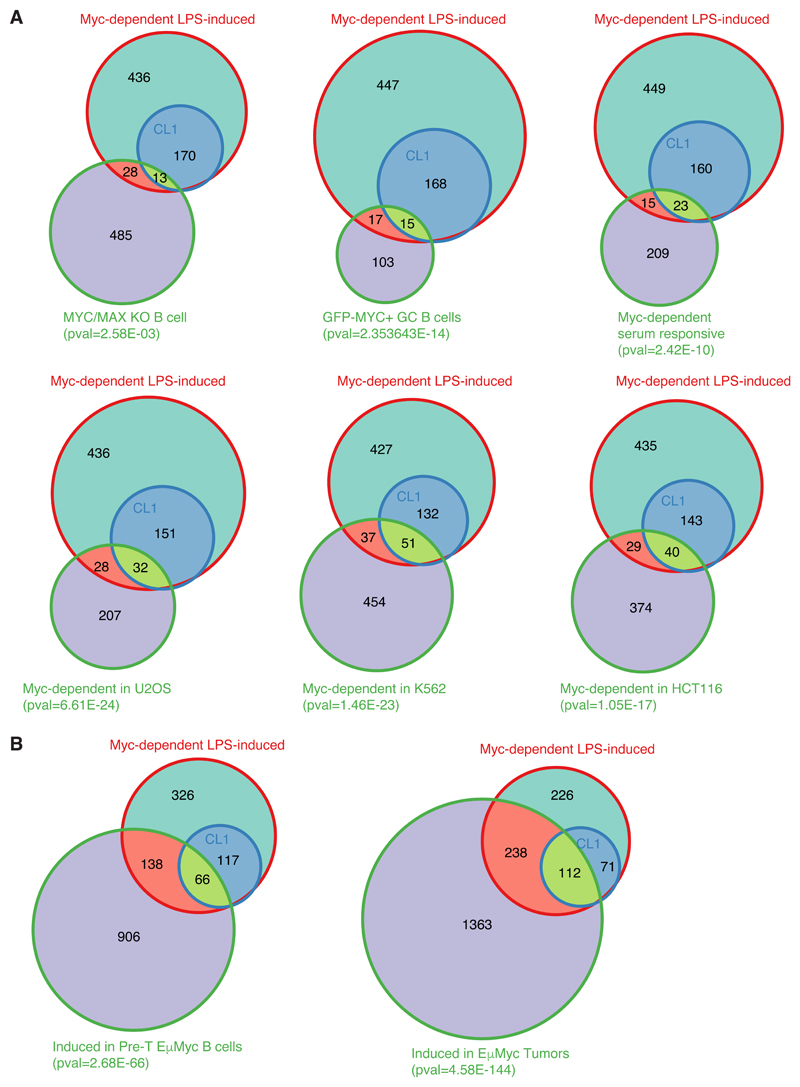
Fig. EV5. Overlap between Myc-dependent LPS-induced genes and other datasets.
A. Venn diagrams representing the overlap between Myc-dependent LPS-induced genes defined in this study (either all genes, or only those in CL1) with other lists of Myc-regulated genes. From left to right, and top to bottom: genes less expressed in Myc/Max KO B-cells activated with LPS for 72h, compared to wt cells [16]; genes more expressed in Myc-positive versus negative germinal center B-cells [10] Myc-dependent serum-responsive (MDSR) genes in fibroblasts [8]; genes down-regulated in Myc-depleted U2OS [29], K562 and HCT116 cells [31].
B. Venn diagrams representing the overlap between Myc-dependent LPS-induced genes defined in this study with genes induced in Eµ-myc B-cells at the pre-tumoral (left) or tumoral stage (right). The p-value of the overlap between Myc-dependent LPS-induced genes and the dataset of interest is shown below each diagram

