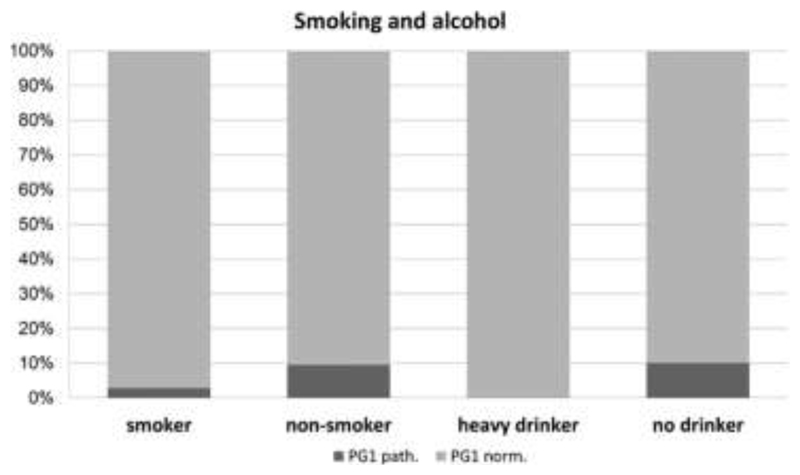
Figure 3. Proportion of patients with pathological PG1 test in relation to smoking and drinking habits.
Displayed is the proportion of patients with pathological PG1 test (<50ng/l) in patients depending on the smoking and drinking habits. Indicated are current smokers as well as patients who considered themselves as heavy drinkers (i.e. regular consumption of alcohol above the recommended limit). PG1 test results were not different between smokers and non-smokers (p=0.753), and there was a trend for a higher proportion for positive PG1 test results in patient that weren’t regular drinkers (p=0.54).

