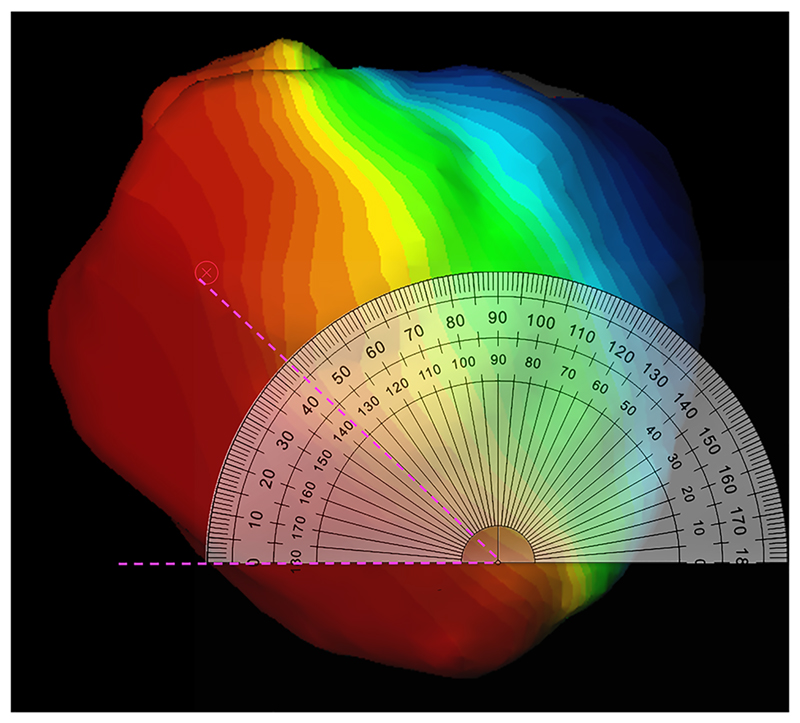
Fig. 1.
Screenshot of calculation of wave front angle. On-screen protractor (Protractor Version 10.0, Softlibs) superimposed on the activation map. The predominant wave front angle is then measured (pink dashed lines); the angle of the same isochrones is then directly compared between the right ventricular pacing map and the LBBB map as both activation maps are identically aligned

