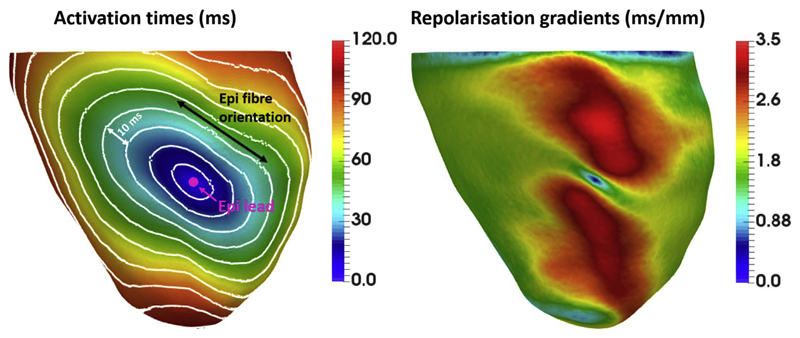
Figure 3.
Activation times (ms) and repolarization gradients (ms/mm) after a point stimulus on the left ventricular epicardial surface of one of the models in our cohort, where the scar was modeled as healthy tissue. Left: Isochrones are 10 ms apart. Location of the epicardial lead is indicated by pink circle. Fiber orientation on the epicardial surface is indicated by the black arrow. Right: Spatial distribution of local repolarization gradients corresponding to the activation sequence shown on the left. Large repolarization gradients (red) spread away from the pacing site in the direction transverse to fibers.

