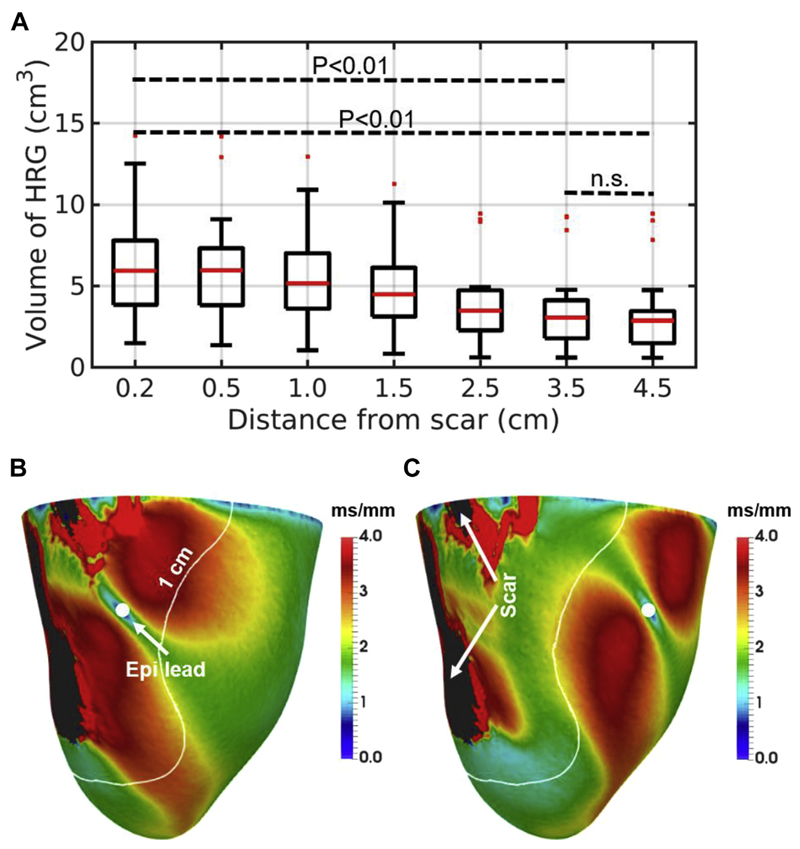
Figure 4.
A: Volumes of high repolarization gradients (HRGs) within 1 cm around the scar relative to pacing distance from scar. P values are displayed. n.s. = nonsignificant. B, C: Example of repolarization gradients within the left ventricular (LV) epicardial surface for one of the models when pacing 0.2 cm (B) and 2.5 cm (C) from the scar. White curves indicate the region 1 cm around the scar. The core of the scar is shown in black. Filled white circles indicate the location of the LV epicardial lead.

