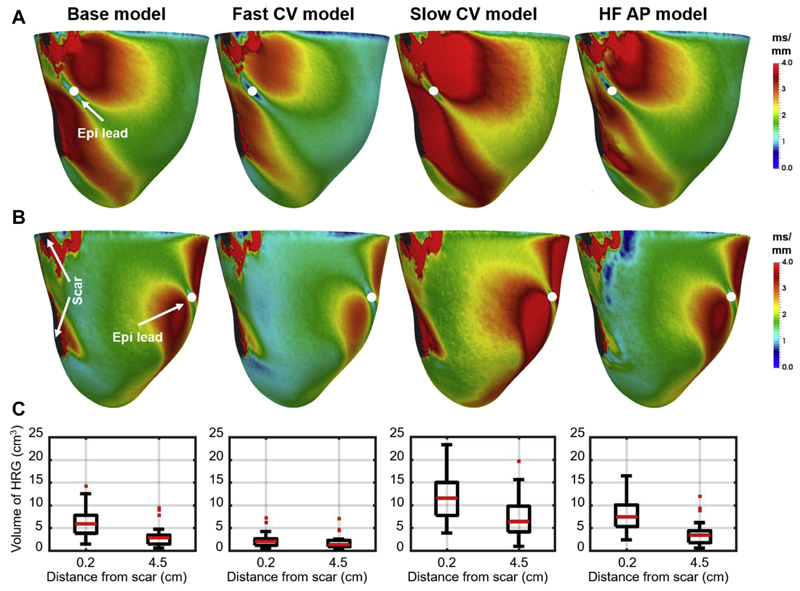
Figure 6.
Effect of electrophysiological (EP) changes commonly found in heart failure (HF) on the volume of high repolarization gradients (HRG) within 1 cm around the scar when pacing 0.2 and 4.5 cm from the scar. From left to right: “Base model” refers to the model with normal conduction velocity (CV) within the left ventricle, slow CV within the border zone (BZ), and normal action potential (AP) morphology; “Fast CV model” and “Slow CV model” refer to models with 20% faster and slower CV within LV and BZ relative to values of the “Base model”, respectively; and “HF AP model” refers to the model with increased action potential duration. A, B: Examples of the spatial distribution of local repolarization gradients when pacing 0.2 and 4.5 cm from scar, respectively. C: Plots of the volume of HRG within 1 cm around the scar when pacing 0.2 and 4.5 cm from scar for each EP model.

