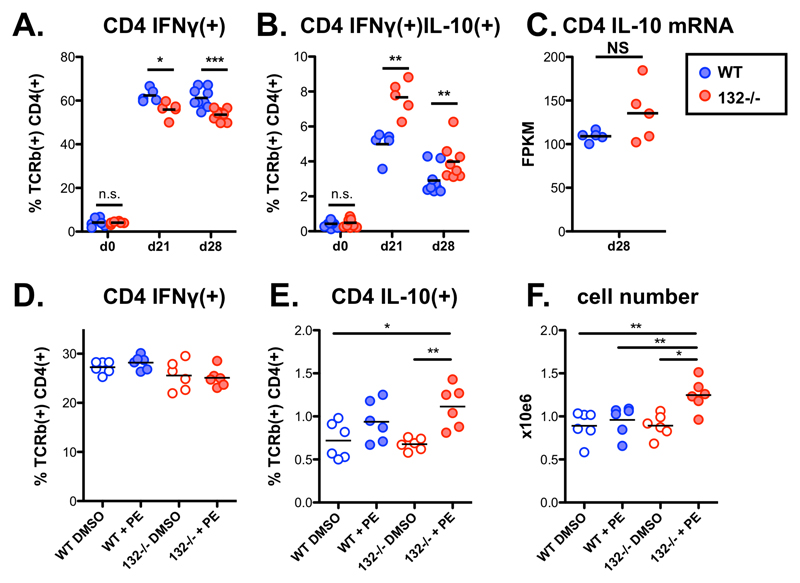
Figure 4. miR-132 controls the balance between IL-10 and IFNγ production in CD4+ T cells.
A. Percentage of IFNγ+ live TCRβ+ CD4+ cells from L. donovani infected WT (blue) or miR-132-/- (red) mice, determined by intracellular cytokine staining. Data representative of 3 independent experiments with 3-5 mice per group.
B. Percentage of IFNγ+/IL-10+ live TCRβ+ CD4+ cells from L. donovani infected WT (blue) or miR-132-/- (red) mice, determined by intracellular cytokine staining. Data representative of 3 independent experiments with 3-5 mice per group.
C. IL-10 mRNA levels, determined by RNA-sequencing, in TCRβ+ CD4+ cells purified from spleens of L. donovani infected WT (blue) or miR-132-/- (red) mice (n=5 per group).
D. Percentage of IFNγ+ WT (blue) or miR-132-/- (red) in vitro polarised Th1 cells (6 days) in the presence or absence of phenylephrine (PE), determined by intracellular cytokine staining.
E. Percentage of IL10+ WT (blue) or miR-132-/- (red) in vitro polarised Th1 cells (6 days) in the presence or absence of phenylephrine (PE), determined by intracellular cytokine staining.
F. Total cell counts following in vitro Th1 polarisation (6 days) in the presence or absence of phenylephrine (PE). For (D-E), cells were purified from 3 mice per group and 6 replicates performed.
Data information: For (A and B) statistical significance was determined by unpaired t-test. For (D–F), significance was determined with 1-way ANOVA followed by Bonferroni’s multiple comparison test. * p<0.05, ** p<0.01, *** p<0.001. NS: not significant.

