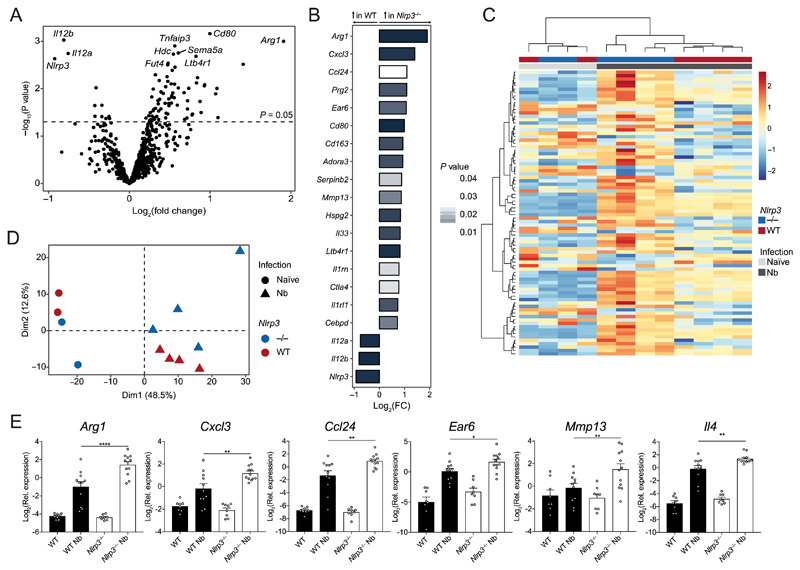
Figure 5. Dysregulated type 2 gene expression in Nlrp3−/− mice following N. brasiliensis infection.
Whole lung RNA from WT and Nlrp3−/− mice on day 7 post-infection with N. brasiliensis (Nb) was analysed by NanoString. (A) Volcano plot showing differentially expressed genes between Nb-infected WT and Nlrp3−/− mice. (B) Top 20 differentially regulated genes between Nb-infected WT and Nlrp3−/− mice (bar colour indicates statistical significance). (C) Unsupervised, hierarchically clustered heatmap of genes differentially expressed 7 days post Nb-infection in WT and Nlrp3−/− mice. (D) Principle components analysis (PCA) of naïve and Nb-infected WT and Nlrp3−/− mice. (E) Candidate differentially expressed genes validated by qRT-PCR (log2 expression relative to Rpl13a). Data were from a single Nanostring run (A–D; n=2-4 mice per group) or pooled (E; mean ± s.e.m.) from 3 individual experiments with 3-5 mice per group (per experiment). Dim: dimension. *P<0.05, **P<0.01, ***P<0.001, ****P<0.0001 (one-way ANOVA and Tukey-Kramer post hoc test).

